Well I thought that was going to go last night. Markets don't usually top on a Thursday night but when I saw that rally into the high 90s in the Eminis and the sharp reversal, I thought it was game on and I put my head on the pillow. I wrote this on twitter just before lights out:
"$ES_F, $SPY- just got out of long position from low 80s into this strength (93). Looking for a climatic reversal tonight to now SHORT"
My plan was always to put a small short position on in the mids 90s and this was a ideal initial level. It seems clear that the 1280 level is being strongly defended however. Those looking for confirmation should now wait for a clear break of that level to confirm. The way the cash market held in last night, I would not be surprised if we grind higher and bit more into next week. Next week the games may really begin.
Emini 60mins:
Sharp bearish reversal right out of the ideal short zone. However, no follow through just yet and buy the dippers were out in force. Add shorts below 1280.
S&P500 60mins:
The slow grindy wedge higher continues. I have seen these patterns so many times and they usually always end in a sharp sell off at a minimum. Be ready
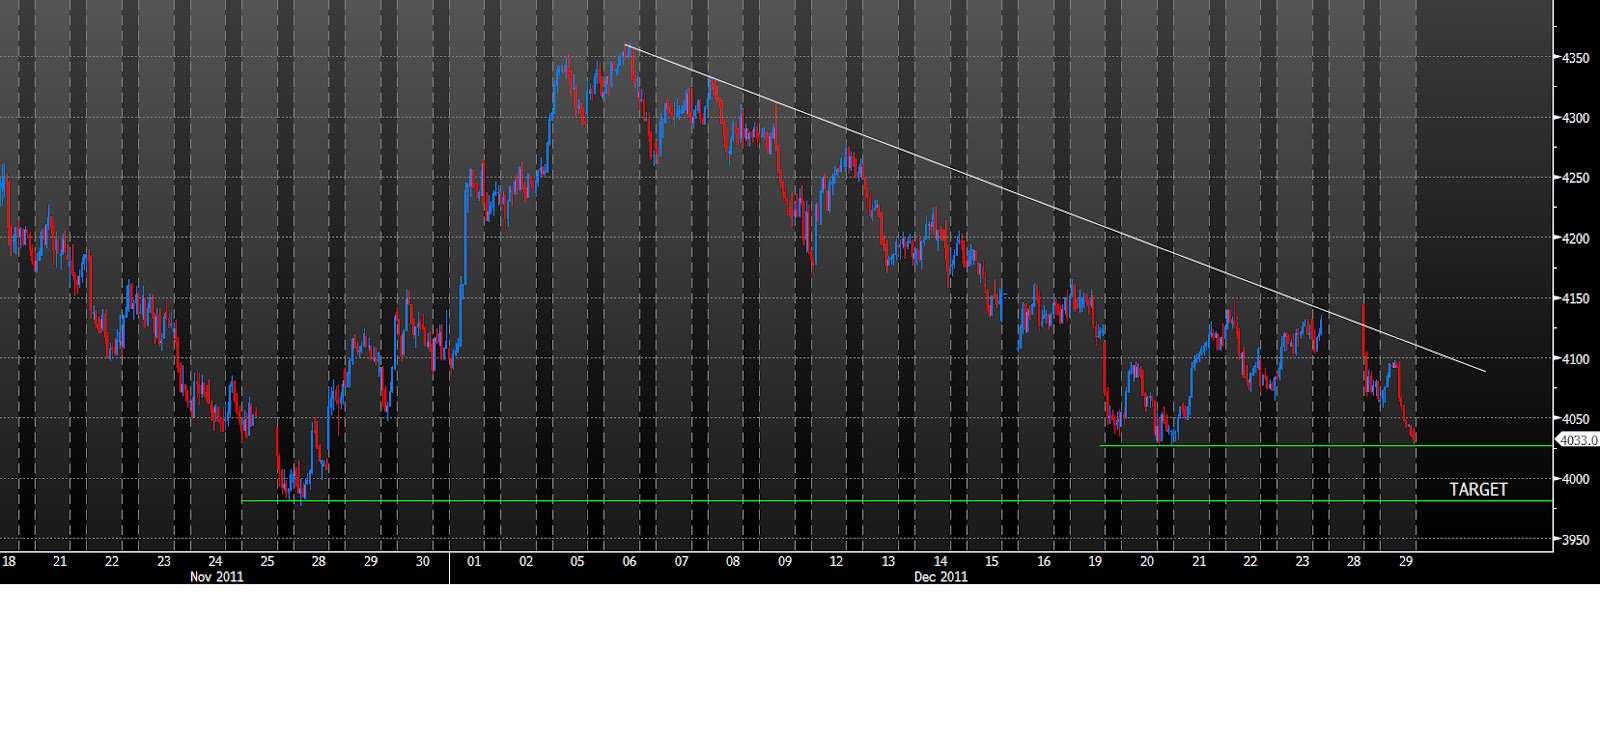
I really don't have too much to update re Australia today. I wrote a rather long post with a number of charts and this remains my primary view: http://swingtradersedge.blogspot.com/2012/01/looking-for-bearish-turn.html.
My initial range today: 4155 to 4190. Outlier levels 4145/50 and 4220
My day trading plan today (SPI): We are indicated at 4180 this morning which represents a gap up of some 30points. There are a whole host of potential resistance points at 4180, 4190 and 4200. This represents the previous SPI high and double top area, the Sycomm highs, and the 4200 round number respectively.
Given it is Friday, I don't think we will see a strong breakout above the 4200 level and I will short fade early vs cited levels. However, I do feel that this market is consolidating before one final push higher thus I would use any early dip into the low 60s to get out. Any stronger sell off to the 50s is a strong buy. Ultimately, today is trade the range day. I will look to short fade 4200 more aggressively today. Fading is a difficult skillset which needs a lot of practice and good tape reading skills. Of course it is very possible that all those resistance levels get blown out of the water. That is why it is so important to gauge the tone, the order book and ultimately view the Candles before short fading an uptrend. If it doesnt sell off early, stop trying to fade!
SPI March 15mins:
Thanks
Austin
Twitter Feed
Friday, 13 January 2012
Thursday, 12 January 2012
Looking For A Bearish Turn
Morning All,
The Eminis retested the 1280 previous breakout zone and held in. I actually got long in this zone as it was such a great low risk trade. My target for this move is somewhere in the 90s and then I will be in full defensive mode. The more and more I look at the charts, the more bearish I am becoming. I am seeing a tiring trend, weakening breadth and momentum, and a whole stack of resistance up here. I reiterate that I think the next good swing trade will be to the downside.
Emini 60mins:
Breakout and retest of the breakout zone. Held like a dream and bulls can now push up their line in the sand once more. I think this will now be the final push into the highs.
Let me illustrate what I mean by tiring breadth. Despite price making higher highs, underlying breadth readings are not making new highs and diverging with price. For instance, here are the 3 highest readings for NYSE advancing issues over the past month or so:
NYSE Advancing issues
21/12/11: 2681
4/1/12: 2555
11/1/12: 2429
Note how each peak reading is getting lower and lower which is NOT what you want in a healthy uptrend or breakout stage.
Total volume also peaked on the 21st December with 945k. Price is making new highs on dwindling volume. If we look at NYSE UP Volume, this is also painting a diverging picture:
NYSE UP Volume:
17/12/11: 1.14bln
21/12/11: 922k
4/1/12: 678k
6/1/12: 651k
In terms of the actual price charts, I see a number of clear wedges or ending diagonals into resistance.
DOW Jones Industrial Daily:
Clear wedge into potential res. I just cant see a strong breakout in this position.
S&P500 60mins:
Weakening momentum and a clear wedge. Do we need 1 more subdivision to complete a 3rd peak and 3 Indians pattern?
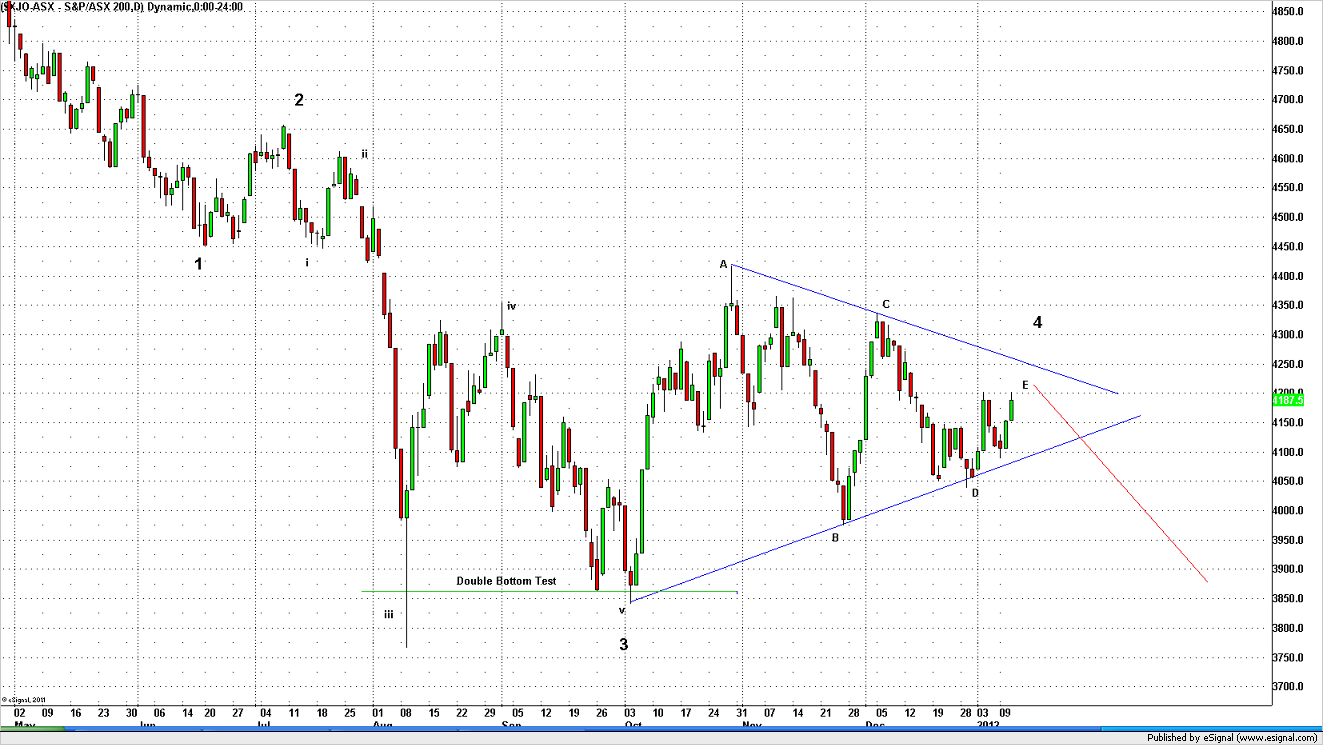
The recent price action in Australia has been bullish no doubt from the low end of the range. However, if this is a genuine turning point in the US, all markets will feel this. I have been monitoring a potential count for a while and now I thought I would show it. Note it is very dangerous forming a count to "fit" in with other markets. However, the more and more I look at the ASX200, AUD and Asian markets, it becomes increasingly clear we are in a triangle of some sort with a potential breakdown looming.
ASX200 Daily:
Perfect alternation between 2 and 4. The subdivisions look clear with the biggest strength and force during iii of 3 down. If we saw a bearish candle reversal in coming days, I think an E leg would be complete and a new trend lower underway.
ASX200 Daily ii:
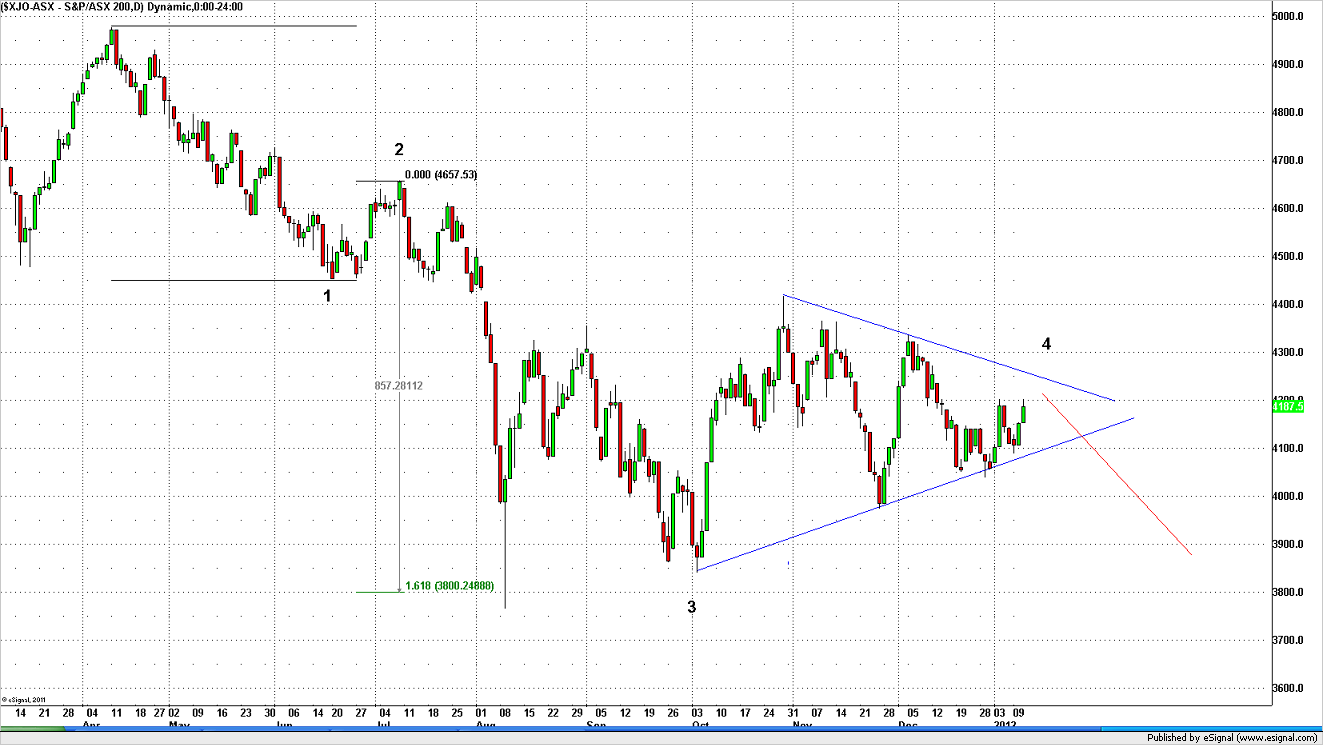
Wave 3 was a perfect 1.618 times the size of wave 1. This chart puts the full move off the top into perspective.
ASX200 60mins:
Are we looking at a potential ABC flat off the low? There are a number of targerts for this move such as 4200 (round number), the 61.8 fib retrace at 4222 and the open gap up at 4240. Of course I have no idea where this will end and that is where your trading skill and reading of the tape comes into play.
SPI Futures 60mins:
Once again, there are a few targets for this move notably 4180, 4200 and 4230. I like the latter level as a great short trade.
In sum, I am growing increasingly bearish. Obviously I do not know when this market turns but there are potential turn dates coming in right now. The key as ever is waiting for confirmation if fading trends. Yesterday I got killed trying to fade the morning drive and I learnt my lessons. Respect the tape, respect the momentum, and wait for the confirm if you are looking for a genuine turning point. The setups are there. Anticipate.
Austin
The Eminis retested the 1280 previous breakout zone and held in. I actually got long in this zone as it was such a great low risk trade. My target for this move is somewhere in the 90s and then I will be in full defensive mode. The more and more I look at the charts, the more bearish I am becoming. I am seeing a tiring trend, weakening breadth and momentum, and a whole stack of resistance up here. I reiterate that I think the next good swing trade will be to the downside.
Emini 60mins:
Breakout and retest of the breakout zone. Held like a dream and bulls can now push up their line in the sand once more. I think this will now be the final push into the highs.
Let me illustrate what I mean by tiring breadth. Despite price making higher highs, underlying breadth readings are not making new highs and diverging with price. For instance, here are the 3 highest readings for NYSE advancing issues over the past month or so:
NYSE Advancing issues
21/12/11: 2681
4/1/12: 2555
11/1/12: 2429
Note how each peak reading is getting lower and lower which is NOT what you want in a healthy uptrend or breakout stage.
Total volume also peaked on the 21st December with 945k. Price is making new highs on dwindling volume. If we look at NYSE UP Volume, this is also painting a diverging picture:
NYSE UP Volume:
17/12/11: 1.14bln
21/12/11: 922k
4/1/12: 678k
6/1/12: 651k
In terms of the actual price charts, I see a number of clear wedges or ending diagonals into resistance.
DOW Jones Industrial Daily:
Clear wedge into potential res. I just cant see a strong breakout in this position.
S&P500 60mins:
Weakening momentum and a clear wedge. Do we need 1 more subdivision to complete a 3rd peak and 3 Indians pattern?
The recent price action in Australia has been bullish no doubt from the low end of the range. However, if this is a genuine turning point in the US, all markets will feel this. I have been monitoring a potential count for a while and now I thought I would show it. Note it is very dangerous forming a count to "fit" in with other markets. However, the more and more I look at the ASX200, AUD and Asian markets, it becomes increasingly clear we are in a triangle of some sort with a potential breakdown looming.
ASX200 Daily:
Perfect alternation between 2 and 4. The subdivisions look clear with the biggest strength and force during iii of 3 down. If we saw a bearish candle reversal in coming days, I think an E leg would be complete and a new trend lower underway.
ASX200 Daily ii:
Wave 3 was a perfect 1.618 times the size of wave 1. This chart puts the full move off the top into perspective.
ASX200 60mins:
Are we looking at a potential ABC flat off the low? There are a number of targerts for this move such as 4200 (round number), the 61.8 fib retrace at 4222 and the open gap up at 4240. Of course I have no idea where this will end and that is where your trading skill and reading of the tape comes into play.
SPI Futures 60mins:
Once again, there are a few targets for this move notably 4180, 4200 and 4230. I like the latter level as a great short trade.
In sum, I am growing increasingly bearish. Obviously I do not know when this market turns but there are potential turn dates coming in right now. The key as ever is waiting for confirmation if fading trends. Yesterday I got killed trying to fade the morning drive and I learnt my lessons. Respect the tape, respect the momentum, and wait for the confirm if you are looking for a genuine turning point. The setups are there. Anticipate.
Austin
Wednesday, 11 January 2012
That Worked, Now What?
Morning All
Well we got the breakout in Australia and subsequently in the Eminis yesterday as forecast here: http://swingtradersedge.blogspot.com/2012/01/turnaround-tuesday.html. The power of Tuesdays I hear you cry. The Eminis broke out and traded just short of my 1293 short zone before selling off and giving back some of its gains. As I write, they are now trading as low as 1284. To me, I think this completes the final legs of this rally and am looking for swing short opportunities. Remember, it is all about low risk/high reward trades and I think fading this market in 1290/1300 with stops above 1310 is the best trade right now. Breadth is waning, volume is not picking up despite the market making new highs, and we now have a clear climatic ending pattern forming in the S&P500 in the form of a 3 Indians (pls see below).
Emini Breakout
The breakout played out perfectly yesterday. Any move now back down below 1280 confirms a failed move higher and a significant high.
S&P500 Daily:
This is the res zone and sell zone. If u are a daily chart trader, wait for that bearish candle confirm out of here. If u are more short term, its time to be switching to fade trades.
S&P500 60mins 3 Indians
A climatic 3 Indians pattern is shaping up. 3 peaks with 3 lower highs on the momentum indicator. Use your appropriate entry signals and anticipate a move lower.
To Australia. My short term low update at ASX200 4100 worked very well: http://swingtradersedge.blogspot.com/2012/01/update.html
Yesterday I wrote in the SPI:
"I still remain in buy mode today given the previous 3 day sell off, the bullish divergences, and the support levels coming into play. Holding above 4100 would indicate a retest of 4115 at a minimum and possibly as high as 4130/4140."
This morning the SPI is indicated at 4148. I think there are 2 possible scenarios here. There is the potential that this is the end of the move higher and we sell off straight away from 4150, resuming the daily downtrend. Or, we continue to grind up to 4180 and retest the previous highs. I am not sure which one will play out obviously but if the Eminis are going to peak here, I cant see Australia rallying much higher.
My range today (SPI): 4120 to 4160. Outlier levels 4180
My plan today: As per above, I will now be switching out of buy mode and potentially looking for a high/bearish reversal. I will short fade 4150/4155 early with stops above 4160. If there is no sell off early, look for this short term trend to potentially grind higher up to 4180 which would present a lower risk short entry.
ASX200 Cash 15mins:
I showed this chart 2 days ago at 4100. We have now seen the breakout and are retesting key Fib res areas.
SPI 60mins continuous:
Yesterdays breakout extended overnight. 4140 is the 61.8 fib retrace and 4150/4155 marks an open gap which could prove some early res. If we don't sell here, we are going to 4180.
Well we got the breakout in Australia and subsequently in the Eminis yesterday as forecast here: http://swingtradersedge.blogspot.com/2012/01/turnaround-tuesday.html. The power of Tuesdays I hear you cry. The Eminis broke out and traded just short of my 1293 short zone before selling off and giving back some of its gains. As I write, they are now trading as low as 1284. To me, I think this completes the final legs of this rally and am looking for swing short opportunities. Remember, it is all about low risk/high reward trades and I think fading this market in 1290/1300 with stops above 1310 is the best trade right now. Breadth is waning, volume is not picking up despite the market making new highs, and we now have a clear climatic ending pattern forming in the S&P500 in the form of a 3 Indians (pls see below).
Emini Breakout
The breakout played out perfectly yesterday. Any move now back down below 1280 confirms a failed move higher and a significant high.
S&P500 Daily:
This is the res zone and sell zone. If u are a daily chart trader, wait for that bearish candle confirm out of here. If u are more short term, its time to be switching to fade trades.
S&P500 60mins 3 Indians
A climatic 3 Indians pattern is shaping up. 3 peaks with 3 lower highs on the momentum indicator. Use your appropriate entry signals and anticipate a move lower.
To Australia. My short term low update at ASX200 4100 worked very well: http://swingtradersedge.blogspot.com/2012/01/update.html
Yesterday I wrote in the SPI:
"I still remain in buy mode today given the previous 3 day sell off, the bullish divergences, and the support levels coming into play. Holding above 4100 would indicate a retest of 4115 at a minimum and possibly as high as 4130/4140."
This morning the SPI is indicated at 4148. I think there are 2 possible scenarios here. There is the potential that this is the end of the move higher and we sell off straight away from 4150, resuming the daily downtrend. Or, we continue to grind up to 4180 and retest the previous highs. I am not sure which one will play out obviously but if the Eminis are going to peak here, I cant see Australia rallying much higher.
My range today (SPI): 4120 to 4160. Outlier levels 4180
My plan today: As per above, I will now be switching out of buy mode and potentially looking for a high/bearish reversal. I will short fade 4150/4155 early with stops above 4160. If there is no sell off early, look for this short term trend to potentially grind higher up to 4180 which would present a lower risk short entry.
ASX200 Cash 15mins:
I showed this chart 2 days ago at 4100. We have now seen the breakout and are retesting key Fib res areas.
SPI 60mins continuous:
Yesterdays breakout extended overnight. 4140 is the 61.8 fib retrace and 4150/4155 marks an open gap which could prove some early res. If we don't sell here, we are going to 4180.
Tuesday, 10 January 2012
Turnaround Tuesday?
Morning All
Last nights action in the Eminis was rather subdued although we did see another recovery off the Asian session lows. A clear breakout pattern has formed and I expect a directional move out of this pattern in coming days. What better moment than a turnaround Tuesday and Full Moon :)
My central case has been for a breakout to 1293/1300: http://swingtradersedge.blogspot.com.au/2012_01_06_archive.html. Thus, I will be looking to buy any breakout above 1280 and looking for price failures in the 1290 region for confirmation of a top.
Emini March 15mins:
A clear cup pattern/consolidation pattern. Is this too obvious and is the whole trading community watching this setup? You just have to go with the breakout first and use triggers above 1280 as confirmation. If price trades below 1265, I would think this is a bull trap and marks a significant top (remember false patterns are the best as the crowd has been sucked in but there is little underlying momentum).
I put out a midday update on the ASX200 at 4100 yesterday looking for a potential short term low. This played out to a small degree but we need to see some follow through today. I still think we are oversold and I see continued bullish divergences which indicates that this move lower over the last 3/4 days is running out of momentum.
SPI 15mins Day Session:
A potential Ending wedge pattern. Price traded right into the open gap target and held. There was some good buying in the low 60s yesterday and the market just could not push any further lower. I have also marked here key short term support and res at 4060 and 4115 respectively.
My inital range today: 4080 to 4120
My plan today: Yesterday I was looking for buy setups and this did not work out until later in the day. However, I still remain in buy mode today given the previous 3 day sell off, the bullish divergences, and the support levels coming into play. We are indicated at 4099. If price quickly sells off down into the low 80s, I will look to position long with a 5 tick stop. Any retest of yesterdays 4062 low should also be bought with very tight stops as ideally we should not trade that low for the bull case to remain. Holding above 4100 would indicate a retest of 4115 at a minimum and possibly as high as 4130/4140.
Thanks
Austin
Last nights action in the Eminis was rather subdued although we did see another recovery off the Asian session lows. A clear breakout pattern has formed and I expect a directional move out of this pattern in coming days. What better moment than a turnaround Tuesday and Full Moon :)
My central case has been for a breakout to 1293/1300: http://swingtradersedge.blogspot.com.au/2012_01_06_archive.html. Thus, I will be looking to buy any breakout above 1280 and looking for price failures in the 1290 region for confirmation of a top.
Emini March 15mins:
A clear cup pattern/consolidation pattern. Is this too obvious and is the whole trading community watching this setup? You just have to go with the breakout first and use triggers above 1280 as confirmation. If price trades below 1265, I would think this is a bull trap and marks a significant top (remember false patterns are the best as the crowd has been sucked in but there is little underlying momentum).
I put out a midday update on the ASX200 at 4100 yesterday looking for a potential short term low. This played out to a small degree but we need to see some follow through today. I still think we are oversold and I see continued bullish divergences which indicates that this move lower over the last 3/4 days is running out of momentum.
SPI 15mins Day Session:
A potential Ending wedge pattern. Price traded right into the open gap target and held. There was some good buying in the low 60s yesterday and the market just could not push any further lower. I have also marked here key short term support and res at 4060 and 4115 respectively.
My inital range today: 4080 to 4120
My plan today: Yesterday I was looking for buy setups and this did not work out until later in the day. However, I still remain in buy mode today given the previous 3 day sell off, the bullish divergences, and the support levels coming into play. We are indicated at 4099. If price quickly sells off down into the low 80s, I will look to position long with a 5 tick stop. Any retest of yesterdays 4062 low should also be bought with very tight stops as ideally we should not trade that low for the bull case to remain. Holding above 4100 would indicate a retest of 4115 at a minimum and possibly as high as 4130/4140.
Thanks
Austin
Monday, 9 January 2012
UPDATE
Seeing the ASX200 cash market come right into the 4100 level at midday. I am thinking this may complete the recent sell off and am looking for a bullish turnaround here. Bottom picking so tight stops.
ASX200 5mins:
A complete 5 down right into 4100. Note the small "breakdown" which could well be a false one.
ASX200 5mins:
Bullish divergences forming here
ASX200 5mins:
A complete 5 down right into 4100. Note the small "breakdown" which could well be a false one.
ASX200 5mins:
Bullish divergences forming here
Monday Monday
Morning All
A rather lacklustre session on Friday night in the US despite the positive jobs number. The Eminis spiked up to the recent highs at 1280 but was met with firm selling, with price closing well back into the range. In my last post, I talked about the possibility of a move up to 1293/1300 before a meaningful top. This is still my central case and will be looking for a potential Tuesday reversal. The range remains 1265 to 1280 and the Eminis are in a clear consolidation range for now so trade accordingly.
Emini 5mins:
Australia has been a lot weaker than I expected which raises the possibility of a false breakout. Certainly there was a very large seller in the Futures market on Friday and we cracked 4100 with relative ease. Interestingly, the low of 4078 was right on the 61.8 Fib retracement. Right now I could make a case either way for this market and hopefully the direction will become clearer now that many traders have returned from their holidays. The charts below illustrate my current thinking and trade setups:
ASX200 Daily:
The low end of the range held but that strong breakout candle has almost been completely filled/retraced. That is not healthy. Ultimately, each bounce is getting weaker and weaker.
ASX200 15mins:
A false breakout from the recent range. Are we looking at an ABC up complete and now a new downtrend once more?
SPI March 15mins:
Note that the sell off from the recent highs does not look impulsive and a low was made right on the 61.8 Fib retracement. This market cannot go lower than here for the bull case to remain valid.
SPI March 5mins:
My range today: 4080 to 4120. Outlier levels 4050 and 4140.
My plan today: Currencies have opened slightly weaker but are recovering. Thus this points us to an open around 4090 I believe. We have sold off 3 days in a row and thus today I will be looking for a potential turnaround/support to hold. I will be scalping 4080/4078 from the long side with tight stops. It is bearish indeed if this level drops. I will look to get out of any longs in the 4100 region and more aggressively short fade at 4120. Very simply, today I am trading the range with a bullish bias until more evidence emerges.
Retail Sales are out at 11.30am
Thanks
Austin
A rather lacklustre session on Friday night in the US despite the positive jobs number. The Eminis spiked up to the recent highs at 1280 but was met with firm selling, with price closing well back into the range. In my last post, I talked about the possibility of a move up to 1293/1300 before a meaningful top. This is still my central case and will be looking for a potential Tuesday reversal. The range remains 1265 to 1280 and the Eminis are in a clear consolidation range for now so trade accordingly.
Emini 5mins:
Australia has been a lot weaker than I expected which raises the possibility of a false breakout. Certainly there was a very large seller in the Futures market on Friday and we cracked 4100 with relative ease. Interestingly, the low of 4078 was right on the 61.8 Fib retracement. Right now I could make a case either way for this market and hopefully the direction will become clearer now that many traders have returned from their holidays. The charts below illustrate my current thinking and trade setups:
ASX200 Daily:
The low end of the range held but that strong breakout candle has almost been completely filled/retraced. That is not healthy. Ultimately, each bounce is getting weaker and weaker.
ASX200 15mins:
A false breakout from the recent range. Are we looking at an ABC up complete and now a new downtrend once more?
SPI March 15mins:
Note that the sell off from the recent highs does not look impulsive and a low was made right on the 61.8 Fib retracement. This market cannot go lower than here for the bull case to remain valid.
SPI March 5mins:
My range today: 4080 to 4120. Outlier levels 4050 and 4140.
My plan today: Currencies have opened slightly weaker but are recovering. Thus this points us to an open around 4090 I believe. We have sold off 3 days in a row and thus today I will be looking for a potential turnaround/support to hold. I will be scalping 4080/4078 from the long side with tight stops. It is bearish indeed if this level drops. I will look to get out of any longs in the 4100 region and more aggressively short fade at 4120. Very simply, today I am trading the range with a bullish bias until more evidence emerges.
Retail Sales are out at 11.30am
Thanks
Austin
Friday, 6 January 2012
An Important Juncture
Morning All,
The S&P500 opened on its lows last night, made a low in the first 10 to 15mins holding the important 1265 level, and then rallied all day to close just off its highs. That is good price action particularly given what was happening in EUR and European financials, and makes me believe that we have higher to push up to 1293/1300. A move up to that zone is a great shorting opportunity and could mark a good bearish turning point. Price is trending higher on weakening internals, breadth and volume which are the conditions to anticipate a climatic turning point or reversal.
The S&P500 chart below shows a number of levels that the current market is "testing". I have also marked a Fibonacci time projection on this which shows that the current rally is a 0.618 time period of the previous move from the market top to October low. This is the ideal place for a "top" in respect to time and this resistance zone is certainly a good area in respect to price. Also note that January is often marked by seasonal tops and highs.
S&P500 Daily
In late October and November, I stressed that the market needed more "time" for a big picture lower high to form:http://swingtradersedge.blogspot.com/2011/11/i-am-bearish.html. This rally is now fulfilling this requirement and if this is a genuine market top in place, we should anticipate a turning point soon. Also note that we have a full moon on the 9th January. Don't laugh but a few days out from a full moon has coincided with a number of short term peaks: http://swingtradersedge.blogspot.com/2011/11/i-am-bearish.html
S&P500 15mins:
Breakout and retest which held last night. We have a potential A=C projection coming in at 1293 which coincides with the resistance zone shown in the Daily chart above. We could be looking at the final subwaves of this C wave but this is of secondary importance. That 1265 line has now become a line in the sand for bulls. My play is to wait for a move up to 1290 and begin shorting with stops above 1305.
And so to Australia. I previously believe that we were transitioning into a new uptrend. Yesterdays price action was certainly weaker than I had expected but we are still looking at a possible breakout. Certainly if the S&P 500 does top, this will lead to a false breakout in Australia. For now however, I will continue to look for a move higher as long as 4100 holds.
ASX200 15mins:
Double bottom, breakout from base pattern, and retest of breakout zone. Still looking to buy vs 4100.
SPI March 5mins:
Note how 4100 was well defended last night. Yesterday we made a high at 4140 on the open so this becomes our key resistance level today.
My range today: 4110 to 4145. Outlier levels 4100 and 4180
My plan today: The SPI is indicated at 4134 and thus bumping right up against yesterdays 4140 high. I will thus look for short fade trades early vs 4140/4145 for a scalp and have stops above. We could have seen a low at 4105 yesterday thus if 4145 lifts to the upside, I will join for a breakout. Note that yesterday was a very slow day yesterday after the initial open and we might see a similar theme given it is a non-farms friday and we seem to still be in holiday season.
UPDATE: The Australian market continues to grind lower and 4100 has broken in the futures. The cash market is still holding onto 4100 but only just. I dont hold much faith given it is a Friday with Asia looking weak- I imagine we will close on our lows. It looks increasingly likely that this recent rally in January is a bear market rally. I had hoped for a move much higher but really not sure if this is the case any longer.
Thanks
Austin
The S&P500 opened on its lows last night, made a low in the first 10 to 15mins holding the important 1265 level, and then rallied all day to close just off its highs. That is good price action particularly given what was happening in EUR and European financials, and makes me believe that we have higher to push up to 1293/1300. A move up to that zone is a great shorting opportunity and could mark a good bearish turning point. Price is trending higher on weakening internals, breadth and volume which are the conditions to anticipate a climatic turning point or reversal.
The S&P500 chart below shows a number of levels that the current market is "testing". I have also marked a Fibonacci time projection on this which shows that the current rally is a 0.618 time period of the previous move from the market top to October low. This is the ideal place for a "top" in respect to time and this resistance zone is certainly a good area in respect to price. Also note that January is often marked by seasonal tops and highs.
S&P500 Daily
In late October and November, I stressed that the market needed more "time" for a big picture lower high to form:http://swingtradersedge.blogspot.com/2011/11/i-am-bearish.html. This rally is now fulfilling this requirement and if this is a genuine market top in place, we should anticipate a turning point soon. Also note that we have a full moon on the 9th January. Don't laugh but a few days out from a full moon has coincided with a number of short term peaks: http://swingtradersedge.blogspot.com/2011/11/i-am-bearish.html
S&P500 15mins:
Breakout and retest which held last night. We have a potential A=C projection coming in at 1293 which coincides with the resistance zone shown in the Daily chart above. We could be looking at the final subwaves of this C wave but this is of secondary importance. That 1265 line has now become a line in the sand for bulls. My play is to wait for a move up to 1290 and begin shorting with stops above 1305.
And so to Australia. I previously believe that we were transitioning into a new uptrend. Yesterdays price action was certainly weaker than I had expected but we are still looking at a possible breakout. Certainly if the S&P 500 does top, this will lead to a false breakout in Australia. For now however, I will continue to look for a move higher as long as 4100 holds.
ASX200 15mins:
Double bottom, breakout from base pattern, and retest of breakout zone. Still looking to buy vs 4100.
SPI March 5mins:
Note how 4100 was well defended last night. Yesterday we made a high at 4140 on the open so this becomes our key resistance level today.
My range today: 4110 to 4145. Outlier levels 4100 and 4180
My plan today: The SPI is indicated at 4134 and thus bumping right up against yesterdays 4140 high. I will thus look for short fade trades early vs 4140/4145 for a scalp and have stops above. We could have seen a low at 4105 yesterday thus if 4145 lifts to the upside, I will join for a breakout. Note that yesterday was a very slow day yesterday after the initial open and we might see a similar theme given it is a non-farms friday and we seem to still be in holiday season.
UPDATE: The Australian market continues to grind lower and 4100 has broken in the futures. The cash market is still holding onto 4100 but only just. I dont hold much faith given it is a Friday with Asia looking weak- I imagine we will close on our lows. It looks increasingly likely that this recent rally in January is a bear market rally. I had hoped for a move much higher but really not sure if this is the case any longer.
Thanks
Austin
Thursday, 5 January 2012
Uptrend
Morning All
I have a busy schedule this morning so will not be able to post charts and thoughts in depth. However, I did want to write just a quick snippet given yesterdays trading. Bottom line, we have seen a meaningful base pattern and breakout in Australia as per my recent trading plan and posts. Yesterdays action was very strong indeed with genuine momentum and size on the order book. This was not a short squeeze but genuine buying straight from the word go. You have to have strategies in place to join this move higher in coming days with stops below yesterdays low (cash or futures). I am not sure how high this move will go but for now focus on this new uptrend. My target zone in the low 4000s worked a treat and now we are clearly seeing a breakout from a sideways base pattern. What more could you ask for?
I will try and posts charts later in the day.
Key SPI levels today:
Support 4120, 4140/45
Resistance 4180, 4200
I will be looking for any move down to the SYCOMM lows of 4120 to get long. We may not be so fortunate so I will also be looking to join any initial momentum should it appear again this am. Watch that order book. Yesterday was the finest example of the need for good tape reading skills. The order book and market depth told you everything you needed to know.
Thanks
Austin
I have a busy schedule this morning so will not be able to post charts and thoughts in depth. However, I did want to write just a quick snippet given yesterdays trading. Bottom line, we have seen a meaningful base pattern and breakout in Australia as per my recent trading plan and posts. Yesterdays action was very strong indeed with genuine momentum and size on the order book. This was not a short squeeze but genuine buying straight from the word go. You have to have strategies in place to join this move higher in coming days with stops below yesterdays low (cash or futures). I am not sure how high this move will go but for now focus on this new uptrend. My target zone in the low 4000s worked a treat and now we are clearly seeing a breakout from a sideways base pattern. What more could you ask for?
I will try and posts charts later in the day.
Key SPI levels today:
Support 4120, 4140/45
Resistance 4180, 4200
I will be looking for any move down to the SYCOMM lows of 4120 to get long. We may not be so fortunate so I will also be looking to join any initial momentum should it appear again this am. Watch that order book. Yesterday was the finest example of the need for good tape reading skills. The order book and market depth told you everything you needed to know.
Thanks
Austin
Wednesday, 4 January 2012
Welcome Back
Morning All,
A continued rally in Europe and the US overnight sees the SPI indicated right in the middle of the recent range at 4100. My 60min ASX200/SPI futures chart has guided us very well thus far with the SPI making a short term low in the low 4000s, right in the target range. Volume has been horrible of late which makes me cautious that we have seen a genuine turning point. Nonetheless, yesterday I said:
"Price is now testing previous lows and support levels. I believe we could be entering a period of transition from downtrend into sideways consolidation/base building. Thus, in the coming days I will be looking for support plays and possible breakouts to the upside if a good base builds. It takes time for a market to
transition and I would not expect a dramatic low straight away."
I believe this is playing out and we just have to be patient for this base and sideways pattern to develop. Please see the updated charts below.
SPI Continuous 60mins:
Price made a low at 4018 right in the cited target range. We have now transitioned from downtrend to sideways. A break above 4150 would confirm a new uptrend and breakout trades for Swing traders.
SPI March 15mins:
We are indicated at 4105 this am which is right in the middle of the recent range. Key levels to the upside are 4140/4150 and support is 4050 and 4020.
I did make a howler yesterday when writing my morning report. I didn't realise that Europe re-opened on Monday for trading with a 2% gain (Emini futures were closed). Thus I did not see the SPI opening at 4080! Not a great way to kick off the new year but ultimately the analysis presented here is still on the
money- we are looking for support plays and possibly breakouts of the recent base.
My Range Today: 4080 to 4120. Outlier levels 4055 and 4145.
My Plan Today: I will be looking to short this move early out of the 4100s. This is a short term short scalp only. I find that the round numbers often prove to be very good short term trading levels as a day trader. I will look to cover any shorts at 4080. If there is no sell off in the first 10 to 15 minutes, then focus on a potential move up to the top end of the range at 4140. Once again to reiterate, swing traders should be looking for confirmation above 4150 that a new uptrend is underway to get long.
I am not one for long term predictions. I believe that the ability to forecast a market drops off dramatically after 2 to 3 weeks even. I have learnt this the hard way. Sure I can see Daily setups which imply a strong move in a certain direction, but I know there can be many twists and turns along the way. I cant stand those Broker reports that hit the presses come January of the new year with projections a year out. So utterly useless and untradeable. Watch them be re-written and revised in a matter of weeks. If the last 4-5 years has taught us anything, it is to expect the unexpected.
Here are a few Daily charts that I am looking at. These always form the backbone of what I do. They are setups and a means for characterising the market- not long term predictions. I posted some of these in a recent post so pls re-read for more detail: http://swingtradersedge.blogspot.com/2011_12_28_archive.html
Australia Daily:
We are at the low end of the recent range. Down here I would be looking for short term support plays and a possible breakout trades to the upside. In the bigger picture, I really do not know which way this market is headed but clearly we are very offered at 4350/4400.
One minor trendline breaks but still within a broader consolidation pattern.
SP500:
This remains the key chart to me. I wrote this on 28 Dec and this remains my view: "Certainly price is now testing a number of overhead res points and thus setting up for some good short fade trades. However, price has hit that 200ma 4 times and keeps popping up for more. If this was a weak market, we should have left this long behind but we haven't. It is resilient. Thus ultimately, we could be looking at an ascending triangle of some sort with a breakout to the upside further down the line." We are now testing the upper end of these levels and as a short term trader, I will be shorting 1295 to 1300, stops above 1310.
A continued rally in Europe and the US overnight sees the SPI indicated right in the middle of the recent range at 4100. My 60min ASX200/SPI futures chart has guided us very well thus far with the SPI making a short term low in the low 4000s, right in the target range. Volume has been horrible of late which makes me cautious that we have seen a genuine turning point. Nonetheless, yesterday I said:
"Price is now testing previous lows and support levels. I believe we could be entering a period of transition from downtrend into sideways consolidation/base building. Thus, in the coming days I will be looking for support plays and possible breakouts to the upside if a good base builds. It takes time for a market to
transition and I would not expect a dramatic low straight away."
I believe this is playing out and we just have to be patient for this base and sideways pattern to develop. Please see the updated charts below.
SPI Continuous 60mins:
Price made a low at 4018 right in the cited target range. We have now transitioned from downtrend to sideways. A break above 4150 would confirm a new uptrend and breakout trades for Swing traders.
SPI March 15mins:
We are indicated at 4105 this am which is right in the middle of the recent range. Key levels to the upside are 4140/4150 and support is 4050 and 4020.
I did make a howler yesterday when writing my morning report. I didn't realise that Europe re-opened on Monday for trading with a 2% gain (Emini futures were closed). Thus I did not see the SPI opening at 4080! Not a great way to kick off the new year but ultimately the analysis presented here is still on the
money- we are looking for support plays and possibly breakouts of the recent base.
My Range Today: 4080 to 4120. Outlier levels 4055 and 4145.
My Plan Today: I will be looking to short this move early out of the 4100s. This is a short term short scalp only. I find that the round numbers often prove to be very good short term trading levels as a day trader. I will look to cover any shorts at 4080. If there is no sell off in the first 10 to 15 minutes, then focus on a potential move up to the top end of the range at 4140. Once again to reiterate, swing traders should be looking for confirmation above 4150 that a new uptrend is underway to get long.
I am not one for long term predictions. I believe that the ability to forecast a market drops off dramatically after 2 to 3 weeks even. I have learnt this the hard way. Sure I can see Daily setups which imply a strong move in a certain direction, but I know there can be many twists and turns along the way. I cant stand those Broker reports that hit the presses come January of the new year with projections a year out. So utterly useless and untradeable. Watch them be re-written and revised in a matter of weeks. If the last 4-5 years has taught us anything, it is to expect the unexpected.
Here are a few Daily charts that I am looking at. These always form the backbone of what I do. They are setups and a means for characterising the market- not long term predictions. I posted some of these in a recent post so pls re-read for more detail: http://swingtradersedge.blogspot.com/2011_12_28_archive.html
Australia Daily:
We are at the low end of the recent range. Down here I would be looking for short term support plays and a possible breakout trades to the upside. In the bigger picture, I really do not know which way this market is headed but clearly we are very offered at 4350/4400.
One minor trendline breaks but still within a broader consolidation pattern.
SP500:
This remains the key chart to me. I wrote this on 28 Dec and this remains my view: "Certainly price is now testing a number of overhead res points and thus setting up for some good short fade trades. However, price has hit that 200ma 4 times and keeps popping up for more. If this was a weak market, we should have left this long behind but we haven't. It is resilient. Thus ultimately, we could be looking at an ascending triangle of some sort with a breakout to the upside further down the line." We are now testing the upper end of these levels and as a short term trader, I will be shorting 1295 to 1300, stops above 1310.
Tuesday, 3 January 2012
Happy New Year
Morning All and Happy New Year
Well I don't know about you, but I am kinda pleased all the festivities are over. It takes it out of you! And then comes Australia Day. And then Anzac Day. And then....
Anyway, as the weeks progress into January, the volumes should start to return as Traders put their fresh balance sheets to work. Last year was an excellent trading environment for the prepared and experienced, and I cant see why that should not be the case again this year. We all know there is a multitude of problems facing our global economy which will provide continuous volatility. Furthermore, the inherent bearish sentiment currently will lead to dramatic squeezes a plenty for those who are prepared. I am sure there are a whole host of traders who learnt some stern lessons last year and our now hungry to put into practise. The one major point that was reinforced to me again last year was the need for flexibility. Really anything can happen. There really is no point trying to overanalyze the words of our political saviours or to try and work out where this global economy is headed. It just will not help. Our job, as sad as it is, is to make money. Have the setups prepared, follow the market price action, and be disciplined enough to take your stops whether losses or gains.
And so to the markets. On the 30 December I wrote: "the SPI is now re-testing the previous 4065 breakdown level. This is a great fade/short level straight up with tight risk. Thus I will be looking to SHORT early with stops above 4080."
This played out although the market fell a lot further than I thought with a number of sell orders hitting the market into the New Year holidays. Now we are trading at the low end of the range and it is time to cover shorts/begin looking for a swing trading low. The 60min chart below I have shown a number of times and is updated below.
SPI Continuous 60mins:
Price is now "testing" previous lows and support levels. I believe we could be entering a period of transition from downtrend into sideways consolidation/base building. Thus, in the coming days I will be looking for support plays and possible breakouts to the upside if a good base builds. It takes time for a market to transition and I would not expect a dramatic low straight away.
SPI March 15mins:
In the last 2 trading sessions, we have seen price open on its highs and close on its lows- bearish indeed. However, I have often found that markets trade from high to low in 3 days. Thus, given the most recent peak was 2 trading sessions ago, we may well be looking at a short term low soon.
My range today: 3095 to 4035. Outlier levels 3075/3080 and 4080. (UPDATE. This range is WAY OFF as market has opened 4080. SHORT!)
My plan today: The market will potentially open below Friday's close given the US trading session. Given the charts adn analysis above, the market is now right into a great support area and it is time to be looking for long trades in coming days. I will scalp long at 4000 with stops below 3095. I will also look to scalp long 3080 should we see some initial pressure. Look to get out of longs/get short at 4025/4030. Ultimately, longer term traders need to wait for a clear base and breakout of 4150 before the big picture LONG trade
(UPDATE: The market has opened well above my initial range. Don't know the news yet, but currencies haven't budged. This doesn't change my big picture view i.e. coming into supports and look for long trades. However, short term I now have to fade this/get short with stops above 4080. This is just day trading. Outlier levels are 4100 on upside and 4050 on downside)
Well I don't know about you, but I am kinda pleased all the festivities are over. It takes it out of you! And then comes Australia Day. And then Anzac Day. And then....
Anyway, as the weeks progress into January, the volumes should start to return as Traders put their fresh balance sheets to work. Last year was an excellent trading environment for the prepared and experienced, and I cant see why that should not be the case again this year. We all know there is a multitude of problems facing our global economy which will provide continuous volatility. Furthermore, the inherent bearish sentiment currently will lead to dramatic squeezes a plenty for those who are prepared. I am sure there are a whole host of traders who learnt some stern lessons last year and our now hungry to put into practise. The one major point that was reinforced to me again last year was the need for flexibility. Really anything can happen. There really is no point trying to overanalyze the words of our political saviours or to try and work out where this global economy is headed. It just will not help. Our job, as sad as it is, is to make money. Have the setups prepared, follow the market price action, and be disciplined enough to take your stops whether losses or gains.
And so to the markets. On the 30 December I wrote: "the SPI is now re-testing the previous 4065 breakdown level. This is a great fade/short level straight up with tight risk. Thus I will be looking to SHORT early with stops above 4080."
This played out although the market fell a lot further than I thought with a number of sell orders hitting the market into the New Year holidays. Now we are trading at the low end of the range and it is time to cover shorts/begin looking for a swing trading low. The 60min chart below I have shown a number of times and is updated below.
SPI Continuous 60mins:
Price is now "testing" previous lows and support levels. I believe we could be entering a period of transition from downtrend into sideways consolidation/base building. Thus, in the coming days I will be looking for support plays and possible breakouts to the upside if a good base builds. It takes time for a market to transition and I would not expect a dramatic low straight away.
SPI March 15mins:
In the last 2 trading sessions, we have seen price open on its highs and close on its lows- bearish indeed. However, I have often found that markets trade from high to low in 3 days. Thus, given the most recent peak was 2 trading sessions ago, we may well be looking at a short term low soon.
My range today: 3095 to 4035. Outlier levels 3075/3080 and 4080. (UPDATE. This range is WAY OFF as market has opened 4080. SHORT!)
My plan today: The market will potentially open below Friday's close given the US trading session. Given the charts adn analysis above, the market is now right into a great support area and it is time to be looking for long trades in coming days. I will scalp long at 4000 with stops below 3095. I will also look to scalp long 3080 should we see some initial pressure. Look to get out of longs/get short at 4025/4030. Ultimately, longer term traders need to wait for a clear base and breakout of 4150 before the big picture LONG trade
(UPDATE: The market has opened well above my initial range. Don't know the news yet, but currencies haven't budged. This doesn't change my big picture view i.e. coming into supports and look for long trades. However, short term I now have to fade this/get short with stops above 4080. This is just day trading. Outlier levels are 4100 on upside and 4050 on downside)
Friday, 30 December 2011
Morning Plan
Good Morning All,
A relatively good recovery overnight in the S&P500 but once again on woeful volume of less than 500m on the NYSE. As I said yesterday at Emini 1245, price is trading right in the middle of the range so there is no clear trade. Last nights bounce once again takes us to an interesting sell area. Given the time of year however, I would advise caution and only very small nimble positions.
S&P500 Emini 5mins:
Price has now rallied into the 61.8 and previous breakdown zone. Nimble traders could initiate shorts here with stops above 1260 or above 1265. There is a potential ABC move off the low but I would hold this count with suspicion given the volumes.
I imagine trading in Australia will be very subdued. Yesterday I said "We are now approaching the low end of the range so it is time to lighten up shorts." Certainly the low of 4018 was not one of my cited levels but the strategy appears to be playing out given we are indicated at 4070. I think yesterday was a perfect example of when reading the tape is of central importance over technicals/levels etc. Indeed, when 4030 dropped, it looked like we were set for a breakdown into 4000. However, genuine size appeared on the bid at 4020 and 4018, by far the biggest number of contracts we had seen on the order book all day. Furthermore, the "breakdown" through the intraday lows occurred at midday, which has a high probability of failure given that volumes dry up at this time of day and there is a lack of conviction. All this aligned for a low and rally in the afternoon session. Reading the tape and understanding the character of the market is so essential in these moments.
SPI Continuous 60mins:
This was my target zone yesterday and we have seen a good initial bounce. I really don't know if we have seen the swing low yet and I probability doubt it given the day of week and lack of volumes. Ultimately, the strategy remains to cover shorts in the low 4000s and turn more bullish if this market breaks 4150 to the upside and a higher high is made. The range and boundaries are clear.
My range today: 4045 to 4080. Outlier levels 4020 and 4095
My day trading plan today: We are looking at a small gap up to 4070. Thus, the SPI is now re-testing the previous 4065 breakdown level. This is a great fade/short level straight up with tight risk. Thus I will be looking to SHORT early with stops above 4080. Any sell off should be capped at 4045/4050 today I believe given the lack of volumes and holiday season. I am not expecting any strong trends and will continue to scalp the cited levels appropriately.
SPI 5mins Day Session:
Retesting the previous breakdown zone of 4065/4070 thus got to short first thing.
A relatively good recovery overnight in the S&P500 but once again on woeful volume of less than 500m on the NYSE. As I said yesterday at Emini 1245, price is trading right in the middle of the range so there is no clear trade. Last nights bounce once again takes us to an interesting sell area. Given the time of year however, I would advise caution and only very small nimble positions.
S&P500 Emini 5mins:
Price has now rallied into the 61.8 and previous breakdown zone. Nimble traders could initiate shorts here with stops above 1260 or above 1265. There is a potential ABC move off the low but I would hold this count with suspicion given the volumes.
S&P500 Daily:
This really is the key chart to bear in mind. Price is "testing" against a number of overhead resistance levels in this zone. This really is a faders dream with the correct stops. Ultimately, we could be look at an ascending triangle here with a breakout either way come the middle of January.I imagine trading in Australia will be very subdued. Yesterday I said "We are now approaching the low end of the range so it is time to lighten up shorts." Certainly the low of 4018 was not one of my cited levels but the strategy appears to be playing out given we are indicated at 4070. I think yesterday was a perfect example of when reading the tape is of central importance over technicals/levels etc. Indeed, when 4030 dropped, it looked like we were set for a breakdown into 4000. However, genuine size appeared on the bid at 4020 and 4018, by far the biggest number of contracts we had seen on the order book all day. Furthermore, the "breakdown" through the intraday lows occurred at midday, which has a high probability of failure given that volumes dry up at this time of day and there is a lack of conviction. All this aligned for a low and rally in the afternoon session. Reading the tape and understanding the character of the market is so essential in these moments.
SPI Continuous 60mins:
This was my target zone yesterday and we have seen a good initial bounce. I really don't know if we have seen the swing low yet and I probability doubt it given the day of week and lack of volumes. Ultimately, the strategy remains to cover shorts in the low 4000s and turn more bullish if this market breaks 4150 to the upside and a higher high is made. The range and boundaries are clear.
My range today: 4045 to 4080. Outlier levels 4020 and 4095
My day trading plan today: We are looking at a small gap up to 4070. Thus, the SPI is now re-testing the previous 4065 breakdown level. This is a great fade/short level straight up with tight risk. Thus I will be looking to SHORT early with stops above 4080. Any sell off should be capped at 4045/4050 today I believe given the lack of volumes and holiday season. I am not expecting any strong trends and will continue to scalp the cited levels appropriately.
SPI 5mins Day Session:
Retesting the previous breakdown zone of 4065/4070 thus got to short first thing.
Thursday, 29 December 2011
Morning Plan
Morning
Well it seems that the big boys are still away and they left the kids on the dealing desk to press the red sell buttons. The S&P500 hit the first resistance zone I talked about yesterday and sold off quite sharply although on woeful woeful volume: http://swingtradersedge.blogspot.com/2011/12/santa-did-his-job.html.
I think it is too early to jump to any strong conclusions. The chart below clearly shows the important short term boundaries for the S&P500. My plan was to fade the Eminis vs the clear resistance levels and this played out overnight leaving us right in the middle of the range. 1220 on the downside is key for the bulls and 1260 has now become the clear resistance level. We closed at 1245 on our lows so I would expect a bit more downside in the short term before any meaningful bounce.
Eminis 15mins:
The target I mentioned yesterday was nailed. We could be looking at a potential ABC move off the low which indicates new lows coming. However, focus on the key support levels of 1220.
To Australia today. In yesterdays session we saw very bearish action straight from the open. The SPI futures are indicated at 4035 and thus we are looking at 30 point gap down on today's open. We are now approaching the low end of the range so it is time to lighten up shorts. The key levels are 4030 and 4000 as shown below. Given it is thursday and holiday season, I really don't expect a strong short term low to form so be quick and nimble if buying at these key support levels.
SPI March 15mins:
Yesterday we saw a strong bearish reversal right out of 4140s and the previous high. Now we are trading at the low end of the range at 4030.
4030 and 4000 are the previous lows and the target for this move.
My range today: 3995 to 4050
My day trading plan today: We will open right on the previous lows at 4030 thus I am in no rush to short first thing. However, given yesterdays price action, looking for shorts is the right play at the right level. I will look to fade the 40s aggresively with stops above 4050. If 4030 drops, get short looking for a move down to 4000. This might be a big ask today. Potential scalp longs at 4030 and the low 4000s. I really don't think 4000s break today so this should be a low risk/high reward buy area.
Well it seems that the big boys are still away and they left the kids on the dealing desk to press the red sell buttons. The S&P500 hit the first resistance zone I talked about yesterday and sold off quite sharply although on woeful woeful volume: http://swingtradersedge.blogspot.com/2011/12/santa-did-his-job.html.
I think it is too early to jump to any strong conclusions. The chart below clearly shows the important short term boundaries for the S&P500. My plan was to fade the Eminis vs the clear resistance levels and this played out overnight leaving us right in the middle of the range. 1220 on the downside is key for the bulls and 1260 has now become the clear resistance level. We closed at 1245 on our lows so I would expect a bit more downside in the short term before any meaningful bounce.
Eminis 15mins:
The target I mentioned yesterday was nailed. We could be looking at a potential ABC move off the low which indicates new lows coming. However, focus on the key support levels of 1220.
To Australia today. In yesterdays session we saw very bearish action straight from the open. The SPI futures are indicated at 4035 and thus we are looking at 30 point gap down on today's open. We are now approaching the low end of the range so it is time to lighten up shorts. The key levels are 4030 and 4000 as shown below. Given it is thursday and holiday season, I really don't expect a strong short term low to form so be quick and nimble if buying at these key support levels.
SPI March 15mins:
Yesterday we saw a strong bearish reversal right out of 4140s and the previous high. Now we are trading at the low end of the range at 4030.
4030 and 4000 are the previous lows and the target for this move.
My range today: 3995 to 4050
My day trading plan today: We will open right on the previous lows at 4030 thus I am in no rush to short first thing. However, given yesterdays price action, looking for shorts is the right play at the right level. I will look to fade the 40s aggresively with stops above 4050. If 4030 drops, get short looking for a move down to 4000. This might be a big ask today. Potential scalp longs at 4030 and the low 4000s. I really don't think 4000s break today so this should be a low risk/high reward buy area.
Wednesday, 28 December 2011
Santa Did His Job
Morning All
Well it looks like the pre-Christmas ramp did its job. In my last post on 15th December I said:
"For what its worth, I could see the market (S&P500) retest 1200/1205 and holding in the coming days". This certainly played out overseas. Call it what you want, but I see it time and time again at this time of year. End of year window dressing, performance chasing, quant algos exploiting low liquidity seasonal tendencies- the list can go on. For me, very simply, there were 2 main buy zones which were shown here on this blog ahead of time: http://swingtradersedge.blogspot.com/2011_12_14_archive.html.
The first buy setup at 1220 did not work and I was stopped out. Take the stop and move on. The next buy zone at 1200/1195 proved to be the low before a 50 to 60 point move. I continue to stress- it is all about identifying low risk/high reward trades. If you are a swing trader, you need to anticipate these turning points as it is where the money is made. Keep pursuing that low risk idea until the market tells you that you are wrong.
S&P 500 Emini Continuous 15mins:
This is how the buy setup worked out. You could have traded the 1200s with a tight stop or you could have waited for confirm i.e. bullish reversal out of support and break of the downward trendline. We are now approaching the target for this move so bulls should be looking to get flat/tighten up.
The ramp job did not play out to the same degree in Asia. Our markets continue to underperform the US and I can't see too much reason for this to change given the character of our trading and the underlying patterns. The Australian futures are capped at 4150/4160 and I would continue to sell against this level. Look for breakouts above.
SPI Continuous 15mins:
Potential base building under 4150 but I am only looking for long trades on a clear break above this zone.
I thought I would finish with a few Daily charts to put the markets in perspective. I don't see a clear underlying theme but it does look like we are set for more weakness ahead as we come into January.
Well it looks like the pre-Christmas ramp did its job. In my last post on 15th December I said:
"For what its worth, I could see the market (S&P500) retest 1200/1205 and holding in the coming days". This certainly played out overseas. Call it what you want, but I see it time and time again at this time of year. End of year window dressing, performance chasing, quant algos exploiting low liquidity seasonal tendencies- the list can go on. For me, very simply, there were 2 main buy zones which were shown here on this blog ahead of time: http://swingtradersedge.blogspot.com/2011_12_14_archive.html.
The first buy setup at 1220 did not work and I was stopped out. Take the stop and move on. The next buy zone at 1200/1195 proved to be the low before a 50 to 60 point move. I continue to stress- it is all about identifying low risk/high reward trades. If you are a swing trader, you need to anticipate these turning points as it is where the money is made. Keep pursuing that low risk idea until the market tells you that you are wrong.
S&P 500 Emini Continuous 15mins:
This is how the buy setup worked out. You could have traded the 1200s with a tight stop or you could have waited for confirm i.e. bullish reversal out of support and break of the downward trendline. We are now approaching the target for this move so bulls should be looking to get flat/tighten up.
The ramp job did not play out to the same degree in Asia. Our markets continue to underperform the US and I can't see too much reason for this to change given the character of our trading and the underlying patterns. The Australian futures are capped at 4150/4160 and I would continue to sell against this level. Look for breakouts above.
SPI Continuous 15mins:
Potential base building under 4150 but I am only looking for long trades on a clear break above this zone.
I thought I would finish with a few Daily charts to put the markets in perspective. I don't see a clear underlying theme but it does look like we are set for more weakness ahead as we come into January.
ASX200 Daily:
Currently, price is stuck right in the middle of this range. I do think we are likely to see a breakdown given that each bounce is getting weaker and weaker. The market was so well offered at 4350/4400 with several reversal bearish candles. Use breaks of 4000 as confirmation of the next leg lower. Shanghai Composite Daily:
This market continues to trade lower. The bounce out of the horizontal support zone in October worked initially but ultimately there was no follow through. Quite simply, focus on this downtrend. There is a potential A=C relationship (or WXY if u want) coming in some way lower yet as well as a potential trend channel. I will only look for big picture buy setups if we can recapture that horizontal line.
Hang Seng Weekly:
Price is consolidating under the support zone in what looks to be a pennant. This is a continuation pattern and thus I anticipate that the next likely move out of this is to the downside given the downtrend in place. This is such a good trading pattern to exploit from a risk/reward perspective. Wait for the breakout either way and use the appropriate stop. Price action has been weak of late despite the bounce in overseas markets and this could be a telling lead indicator.
S&P500
It is difficult to know what to make of this market currently. Certainly price is now "testing" a number of overhead res points and thus setting up for some good short fade trades. However, price has hit that 200ma 4 times and keeps popping up for more. If this was a weak market, we should have left this long behind but we haven't. It is resilient. Thus ultimately, we could be looking at an ascending triangle of some sort with a breakout to the upside further down the line. For now, I am looking at fading those res points.
It is good to be back. I am really excited about the upcoming year and the opportunities ahead. As ever, I hope to relate my experiences and trades ideas through this blog.
Austin
Thursday, 15 December 2011
Stopped Out and Going Surfing!
Morning All
Well we have had a good run of late in this market, successfully negotiating a number of turns but my luck has finally run out overnight. The SPI successfully held the double bottom area of 4170 all day yesterday but there was no follow through above 4200 to the upside. The Eminis have subsequently broken through my 1220 level and thus negated my first buy zone. Take the stop and move on- it's that easy.
If I am honest, I don't have a clear view here now. I stressed that as long as the S&P500 remained above 1200, we should look for buy setups: http://swingtradersedge.blogspot.com/2011/12/little-present-from-santa.html. We have not broken through this yet but it is not looking promising. I really don't like this time of year for trading or for making any grand calls. You will find that there is a lot of window dressing and a lot of "funny" moves as we approach Christmas time/Year end. Thus, I really don't think we break down but I guess you just got to follow the price action.
For what its worth, I could see the market retest 1200/1205 and holding in the coming days. In Australia, the 61.8 Fib retracement comes in at 4125/4120 and I love trading this Fib number (note that these are DEC future levels; the front month is now MARCH)
Unfortunately, I am now off on holidays for a week surfing up the coast. As I said, I don't like this time of year for trading. I really hope you have been enjoying the new formats of late. In the New Year I really plan to dedicate more time and resources to this blog. I have been sent a number of emails of late asking for trading tips and advice. This is great and I value the interaction. My dream is really to reach out to short term traders and provide first rate analysis and education. I know how tough trading is and I know the journey that is needed. I wholeheartedly agree with Brett Steenbarger that Trading is a performance discipline, and trading performance can be cultivated through the same kind of training activities that generate expertise in such diverse domains as athletics, chess, and the performing arts etc. Expertise is the outcome of a process. It takes time and training. I hope to be a mere guide along that way.
Thanks and good luck next week
Austin
Well we have had a good run of late in this market, successfully negotiating a number of turns but my luck has finally run out overnight. The SPI successfully held the double bottom area of 4170 all day yesterday but there was no follow through above 4200 to the upside. The Eminis have subsequently broken through my 1220 level and thus negated my first buy zone. Take the stop and move on- it's that easy.
If I am honest, I don't have a clear view here now. I stressed that as long as the S&P500 remained above 1200, we should look for buy setups: http://swingtradersedge.blogspot.com/2011/12/little-present-from-santa.html. We have not broken through this yet but it is not looking promising. I really don't like this time of year for trading or for making any grand calls. You will find that there is a lot of window dressing and a lot of "funny" moves as we approach Christmas time/Year end. Thus, I really don't think we break down but I guess you just got to follow the price action.
For what its worth, I could see the market retest 1200/1205 and holding in the coming days. In Australia, the 61.8 Fib retracement comes in at 4125/4120 and I love trading this Fib number (note that these are DEC future levels; the front month is now MARCH)
Unfortunately, I am now off on holidays for a week surfing up the coast. As I said, I don't like this time of year for trading. I really hope you have been enjoying the new formats of late. In the New Year I really plan to dedicate more time and resources to this blog. I have been sent a number of emails of late asking for trading tips and advice. This is great and I value the interaction. My dream is really to reach out to short term traders and provide first rate analysis and education. I know how tough trading is and I know the journey that is needed. I wholeheartedly agree with Brett Steenbarger that Trading is a performance discipline, and trading performance can be cultivated through the same kind of training activities that generate expertise in such diverse domains as athletics, chess, and the performing arts etc. Expertise is the outcome of a process. It takes time and training. I hope to be a mere guide along that way.
Thanks and good luck next week
Austin
Wednesday, 14 December 2011
Is This Still A Buy?
Morning All,
Well last night everything was going to plan as I went to bed, with the SPI trading at 4220......and then Ben spoke. The market obviously didn't like what it heard and the S&P took a small tumble closing just off its lows. Commodities all joined in the rout. Quite crazy that this market is acting like a spoilt child, throwing toys out of the pram as we didn't get any beloved QE3 and more free money!
Does this invalidate my recent bullish outlook? On the contrary, I think we may have seen the final subdivisions for a genuine low. Last night volume was not indicative of a new leg lower with only 850m trading on the NYSE. Sure it may seem that all the catalysts have now been and gone, but these are often the exact conditions that lead to a turning point. If the crowd is all leaning bearish, be careful. Lets go to the charts and start with the S&P500.
Emini S&P500 15mins:
Price did rally nicely initially only to be capped at that downward sloping trendline. However, we are still very much in the buy zone/support zone. This is a confluence of the 38.2 retracement, the low end of a potential wedge, and an A=C move off the top.
Emini S&P500 5mins:
This shows the potential wedge pattern in more detail. Some would label this as complete with an E leg now in place. However, for me I see clear symmetry with A=C at 1220. This is such a great area for low risk buy entries with stops around 1215/1210.
Also note that volume has been anaemic of late. Sure we would expect this during Christmas, but equally this is not indicative of a new breakdown lower.
And so to Australia today. Yesterday the plan was to look for the double bottom trade and my 4170 level proved to be a great turning point initially with market bouncing strongly up to 4225. However, as mentioned, we were beaten down in line with US markets.
SPI 5mins:
Support area was perfectly tagged. Breakout of 4205/4210 thus confirming the setup. However there was no follow through and we are now right back down at the previous days lows.
Just as with the Emnis, I still think we should be looking to buy this zone as traders. The chart below shows a clear support zone fro 4150 to 4170. Sure this may not be a clean double bottom but this support zone is still valid. I do have a small concern given our weighting to the resources and gold. Nonetheless, the chart below shows the setup with a potential 5 wave move down to complete us this am.
SPI 15mins:
My range today: 4158 to 4200. Outlier levels 4125 (61.8 retracement) and 4150.
My plan today: I will look for any initial sell off into the Sycomm lows of 4157/4158 to get long with tight stops. This is a short term trade only. If we cant hold these 50s today, I fear that this bullish setup is invalidated, but for now focus on buying support until it drops. I will be looking to get out of longs at 4180s and shorting at 4195/4200 with tight stops. Longer term traders should wait for a solid breakout/60min candle closes above 4205/4210 for the big picture Long trade
Well last night everything was going to plan as I went to bed, with the SPI trading at 4220......and then Ben spoke. The market obviously didn't like what it heard and the S&P took a small tumble closing just off its lows. Commodities all joined in the rout. Quite crazy that this market is acting like a spoilt child, throwing toys out of the pram as we didn't get any beloved QE3 and more free money!
Does this invalidate my recent bullish outlook? On the contrary, I think we may have seen the final subdivisions for a genuine low. Last night volume was not indicative of a new leg lower with only 850m trading on the NYSE. Sure it may seem that all the catalysts have now been and gone, but these are often the exact conditions that lead to a turning point. If the crowd is all leaning bearish, be careful. Lets go to the charts and start with the S&P500.
Emini S&P500 15mins:
Price did rally nicely initially only to be capped at that downward sloping trendline. However, we are still very much in the buy zone/support zone. This is a confluence of the 38.2 retracement, the low end of a potential wedge, and an A=C move off the top.
Emini S&P500 5mins:
This shows the potential wedge pattern in more detail. Some would label this as complete with an E leg now in place. However, for me I see clear symmetry with A=C at 1220. This is such a great area for low risk buy entries with stops around 1215/1210.
Also note that volume has been anaemic of late. Sure we would expect this during Christmas, but equally this is not indicative of a new breakdown lower.
And so to Australia today. Yesterday the plan was to look for the double bottom trade and my 4170 level proved to be a great turning point initially with market bouncing strongly up to 4225. However, as mentioned, we were beaten down in line with US markets.
SPI 5mins:
Support area was perfectly tagged. Breakout of 4205/4210 thus confirming the setup. However there was no follow through and we are now right back down at the previous days lows.
Just as with the Emnis, I still think we should be looking to buy this zone as traders. The chart below shows a clear support zone fro 4150 to 4170. Sure this may not be a clean double bottom but this support zone is still valid. I do have a small concern given our weighting to the resources and gold. Nonetheless, the chart below shows the setup with a potential 5 wave move down to complete us this am.
SPI 15mins:
My range today: 4158 to 4200. Outlier levels 4125 (61.8 retracement) and 4150.
My plan today: I will look for any initial sell off into the Sycomm lows of 4157/4158 to get long with tight stops. This is a short term trade only. If we cant hold these 50s today, I fear that this bullish setup is invalidated, but for now focus on buying support until it drops. I will be looking to get out of longs at 4180s and shorting at 4195/4200 with tight stops. Longer term traders should wait for a solid breakout/60min candle closes above 4205/4210 for the big picture Long trade
Subscribe to:
Posts (Atom)