Thursday, 12 April 2012

The Ides of March Update

Beware the Ides of March! A quick glance on google informs me that the "Ides of March" refers to a date on the 15th March on which Julius Caesar was assassinated in 44BC. A turbulent event no doubt. In this post, I wanted to highlight the effect that the month of March has on the stock market. I think you will be amazed at the turbulence it provides. Back when I worked for Morgan Stanley, my old trading colleague used to stress to me the importance of this month as a turn window whether it be an important high or low. The examples I show here will no doubt illustrate this. The key is the underlying sentiment as the window approaches.

As I analyse the global indices today, I am amazed once more at the influence of this seasonal window. So many markets have turned right into this and I think the evidence is growing for a significant top.

Firstly, let me show over the last 10years how the S&P500 has traded around the month of March. Lots of charts here but really this should be quite easy to scan through.

S&P 500 Daily March 2000:
The big 2000 market top that ended the tech bubble. Where did the S&P500 peak? Right into March. A initial 200pt panic sell off ensued.

Where did this initial sell off bottom? Right into March 2001

March 2001:
March 2001 proved to be a strong intermediate low. A 250pt rally followed.

March 2002:
March 2002 topped out a countertrend rally. A destructive sell off followed from 1175 down to a panic low of 780!

The wave 2 low and bottom of the bear market was....right into March 2003

March 2003:

March 2004:
Although not topping out the entire Bull market, certainly March 2004 led to an intermediate high and a 6month sell off from 1160 to 1060 followed.

March 2005:
Again, another important intermediate high right into March 2005. The market sold off quite sharply from 1230 to 1140.

When did the first rumbles of the US housing bubble emerge? You guessed it, March 2007. This time was associated with a panic low in the S&P500.

March 2007:

March 2008:
In 2008 we were on the onset of a crisis. The market put in a intermediate low back then in March 2008 as BEAR STEARNS was bailed out by the FED. Bearish sentiment was at a fever pitch at this point- cue bear squueze.

March 2009:
And just when things seemed their worst, just when it seemed like the financial world was ending as we knew it, the market bottomed in March 2009.

March 2011:
The Japanese earthquake led to a market top in February thus a bit earlier than the window. However, after a 100pt sell off, sure enough we bottomed right into March.

And so here we are now in March 2012. Bullish sentiment levels are at extremes. Underlying momentum and volume despite the run up has been deterioarting for many months. Each new high has produced weakening breadth readings. And finally we have seen a small pullback. Will this produce something more meaningful? I am betting it will.

S&P500 2012:
The cash high was 2nd April (futures high was 27 March). The correction thus far has been roughly 60pts. If history is any guide, expect a whole lot more down the line.

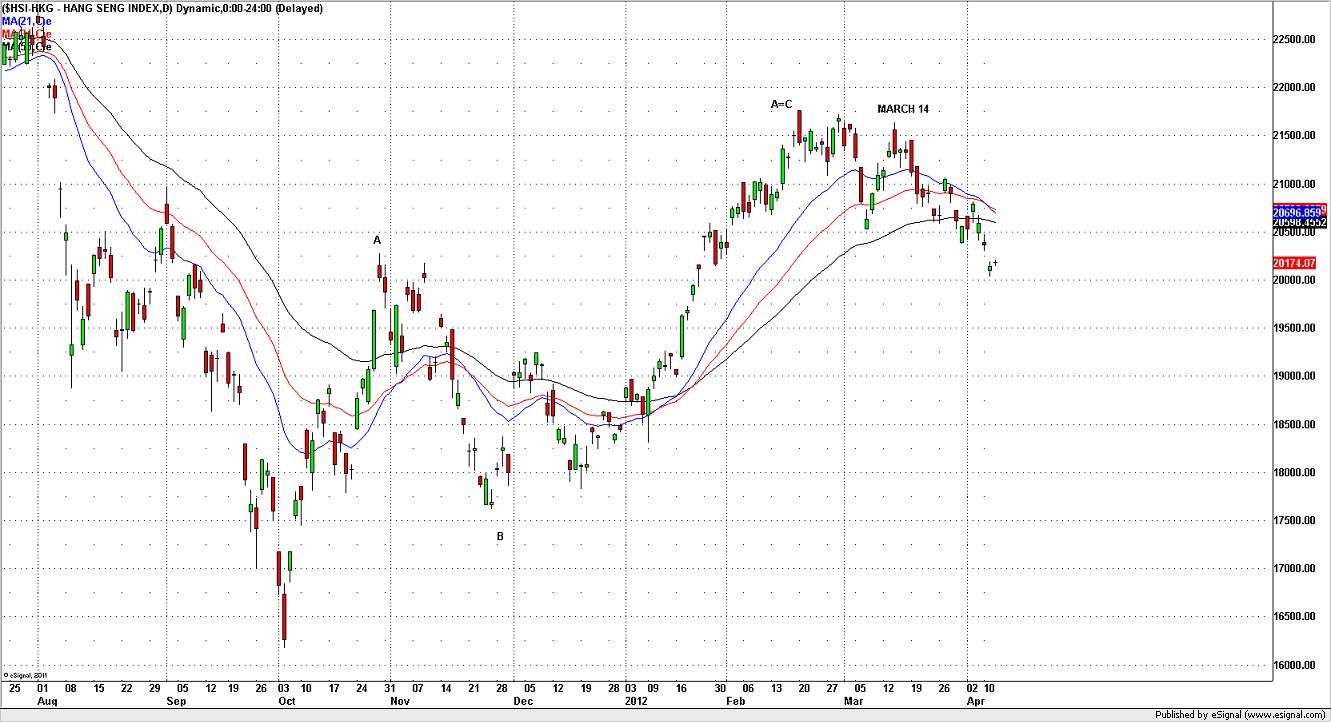
A quick look at other markets shows interesting tops right into March as well. The sell offs look impulsive.

Eurostoxx Daily:


Hang Seng Daily:

Nikkei Daily:

BEWARE THE IDES OF MARCH.

Thursday Plan

This is an Asian Trading blog. I am based in Sydney and my main purpose for setting this up was to share Asian trading setups and technical analysis. I didn't see enough blogs doing this and thus I really wanted to make an impact and provide some quality analysis of the region.

No doubt at times it pays to look overseas. Sure one has to be careful to not get involved in "analysis paralysis" and I strongly believe that you have to really focus on your underlying trading vehicle and market. Just focusing on the bearish setups in Asia coming into the end of March proved this point as we preceded the highs of the US: http://swingtradersedge.blogspot.com.au/2012/03/asian-daily-setups.html. Look how that Nikkei trade played out! If I had been relying on the S&P500 to make some of my decisions, I would have really missed out on what is going on in Asia.

However, this morning I have been looking at a few Daily charts in Europe and US. The more and more I look, the more I think that we really have seen a meaningful high in the bigger picture. Now may not be the time to short this but any strength in the next 2 weeks I think will provide a great opportunity. Note that March very often produces a major top or bottom throughout history. This has kinda snuck in.

Eurostoxx Daily:
This is clearly an ABC pattern. We have now seen overlap and thus this really cant be an impulse off the October lows. This topped right into a resistance zone and the sell off from the high is looking increasingly impulsive.

DAX Daily:
Clearly the DAX has been a stronger market. However, I can also make the case for a complete ABC move off the low topping right into res. Once again, the top occurred right into March.

S&P500 Daily:
Last night we held that generic trendline I had drawn. However, bigger picture we are trading below my 1370 key pivot. This count was shown to me by my friend at marketletters. Note the momentum divergences into the high AND breadth was also seriously lagging. I am not saying be short here, but a bearish picture is emerging.

RUSSELL Daily:
The Russell is often know as the beta index. What I find interesting is that unlike the S&P500, this market did not break above its May highs but topped some way short. This is a bearish divergence. Furthermore, we have seen a clear FAILED breakout. These are my favourite trading patterns and imply genuine weakness.

So there are a few things to think over. As ever, timing is everything and I don't think being short after the first big sell off is the best trade. I hope to update you as this plays out.


To Australia. Yesterday was another frustrating one as a day trader. We traded in a 15pt range for most of the day (despite a big sell off in the US). We then finally broke down in the last 15minutes of trade right into my target area.

SPI 60mins:

I could make a case for somekind of ending wedge pattern here. Clearly we are not breaking down impulsively like other markets for now and we are into a decent support area. Potential short term bounce coming but wait for confirmation.

XJO 15mins:

My SPI range: 4240 to 4280. Outlier level 4300.

My SPI day trading plan: We are indicated around 4260 on the open. This is right in the middle of the recent range and thus I don't have an early obvious trade. I will be looking to BUY 4245/4240 if we see an initial sell off and I will be looking to short fade 4272/4275 with tight stops. Note that there is also a possible outlier res level at 4280. Any genuine strength above 4275 (yesterdays high) opens up a potential move back into 4300 and higher. This would trigger that ending wedge pattern above. The trend is still down obviously so waiting for price to confirm is key.

Thanks
Austin

Wednesday, 11 April 2012

Mmmmmmm

Markets go UP and they go DOWN. The last week or so we have seen the forces of gravity do its thing...and then some. Make no mistake, this is the biggest casino in the world and when the herd finds itself caught one way, a sharp panic ensues. For all the work and progress throughout the year, and despite improving "fundamentals", the trend that has been in place can come undone very quickly indeed.

I didn't see this recent pullback coming in US markets. I guess that is the nature of how tops should form. They should catch everyone off guard in a wave of euphoria when things look their best. However, certainly I have been concerned with the technical picture down here in Asia and put up several posts noting serious topping patterns. These can be re-read here:

Australia topping pattern: http://swingtradersedge.blogspot.com.au/2012_04_03_archive.html

Asia concerning: http://swingtradersedge.blogspot.com.au/2012/03/asian-daily-setups.html

So where does this leave us now? It really is a difficult one as this market will go as low as it needs to flush out trapped longs and low enough to get Central Bankers pumping more liquidity into the system. It is just so tiring. Pump trillions into the market to generate a low volume synthetic bull market; then try to turn off the liquidity taps only for the market to throw its toys out of the pram. Central bankers intervene once more to come to the rescue. Wash, rinse, repeat. I really don't know if we put in a low soon or whether this just keeps snowballing.

The low of that weekly candle I blogged about a while ago has now been clipped. This was a line in the sand for me. Thus at a minimum we are looking at a change of trend/deep pullback.

S&P500 Weekly:
Breakout above 1370 only to be slapped back down. Note the several other occasions throughout this run up when we have seen bullish candles filled- a significant pullback at a minimum.

S&P500 Daily:
My 55 moving average was breached last night. Price has sold off into a generic upward trendline but I don't really use these in my trading. I guess the logical target for this move for now is 1340 support zone and then we have to see.

S&P500 60mins:
Potential trend channel coming in also at 1340.

In sum, at some point we will make a low and I will be looking for a consolidation pattern/base pattern first before getting long once more. I thought we would hold in last night but clearly this is stronger than anticipated. I don't think this will be a V-shaped type low thus being patient and waiting for the setup is key. I also don't think now is the time as a swing trader to be looking for shorts. That has played out in the short term. In my experience, these are the points to not get too bearish. Also note that currencies barely sold off last night despite US weakness, an interesting divergence.

To Australia. This has been such a frustrating sell off from the high. I talked about a clear topping pattern in our market BUT it has been so difficult to get into, especially as a day trader. for the last 3 sessions we have gapped down only to grind higher for the rest of the day. And now we are indicated at 4250 which was my original target for this whole pattern!!!! I wrote the target for this pattern here: http://swingtradersedge.blogspot.com.au/2012_04_04_archive.html. Frustrating indeed.

SPI 5mins:

So we are looking at another gap down this morning into good supports. Will bulls step up once again and BUY this? Really is a tough one and I just don't know. You just have to follow the price action. Some things to note though in Australia:

1) A complete 5 wave advance into the high on the 60mins timeframe. A Head and Shoulders top has formed and been triggered.
2) Clear Failed breakout pattern on the Daily
3) Breakout above the 200 day moving average only for price to be slapped back down through it.
4) BHP is set to break 33.80/34 today which is obviously a big support level.

XJO Daily:

SPI 60mins:

My SPI range: 4240 to 4270. Outlier levels 4220 and 4200.

My SPI day trading plan: This is going to be a very difficult day to call and thus I am hesitant to call anykind of range. Bottom line we have gapped down into supports at 4240/4250. I would be looking to buy it early with very tight stops if I see the right confirmation. Any failure to bounce is bearish and we could be looking at a genuine flush. At some point, the bulls may just have to give up. I will not hang around if we cant hold and will flip to short targeting the low 4200s. Have to be patient today and wait for that early range to form.

Thanks
Austin

Thursday, 5 April 2012

Happy Easter All

Morning All

Yesterday was a classic example of why trading the Australian stock market is just so difficult. We had an obvious breakdown through a neckline of a Head and Shoulders pattern and clear support. However, this led to a classic short term bear trap. I wrote about this my post as I expected as much: http://swingtradersedge.blogspot.com.au/2012/04/wednesday-plan.html. The market failed to breakdown and we grinded higher throughout the day, closing on the highs. And then as soon as the day session is closed, prices really start to sell off and we are now indicated below yesterdays lows! Tough. As much as I hate to say it, we are still very much pawns of our overseas brethren. That EUR short setup I talked about sparked all last nights weakness.

Thus you really have to make a choice as an index trader in this timezone. You either day trade and close all positions out at the end of the day. This way you cant be beaten up by offshore moves and you can comfortably turn off your screens at the end of the day. You are not going to catch the big chunky overnight moves and much of the trend, but equally your risk is quantified. The alternative is to swing trade the index and this will obviously require much wider stops. Your trade idea may be spot on but your overnight position will be at the mercy of offshore moves. You have to accept this. There will be many times when you will be stopped out unfairly or unexpectedly. Its tough. It has taken me a while to come to a realisation of what works for me in this timezone and I believe many traders need to undergo this process.

And so to today's trading. Obviously it is Easter Weekend and this will be the last trading session until Tuesday morning with a nice non-farm payrolls figure coming on Friday. I think it goes without saying that most traders will be shutting up shop and closing positions with this kind of headline risk. Thus, given that the weak overnight lead, it is very possible that we see some genuine selling today in Australia with "investors" not wanting to make any big bets here. This is just me talking out loud here so trade what you see.

SPI 15mins:
This is the fake breakdown I talked about yesterday. Very frustrating for most. I show this just as an example as I have seen this pattern time and time again. Its why I blogged about it yesterday pre open.


SPI 15mins:
More importantly, now that this "false breakdown" is over, it actually opens up the potential for a genuine move lower! Bulls who have bought into this zone repeatedly are now underwater and key short term supports have now dropped. The targets are 4300/4305 but more importantly down at 4270/80. That does look like one serious topping pattern to me.


XJO 60mins:
We are indicated at 4312 in the futures which is around 4300 for the cash market. Thus we are set to open BELOW that key breakout zone I talked about. The key will be gauging the early morning move. Any failure to bounce is bearish indeed. Note the 38.2 fib retracement from the high to recent low comes in at 4288 as a small outlier.

My SPI Range today: 4280 to 4325. Outlier levels 4330

My SPI day trading plan: Yesterdays low was 4318 and we are indicated below this at 4312. Straight from the open I would be looking to short against this level with stops above 4325. An ideal short level would be 4320 I believe. The target for any initial short is down to 4305/4300 and I will cover into there. There is a confluence of supports at 4300/4305 and I would not be surprised if we held in there for a while. Any failure to bounce out of there and I will short for a breakdown trade, targeting my 4275/4280 levels cited. Given it is the day before Easter, if we don't break 4300 than this could be a fizzler in the afternoon.

The key as per yesterday is gauging the early morning strength. Yesterday the cash market bottomed straight after the open and there were back to back bullish candles on the 5min charts. You have to heed this and don't fight it. Similarly today, if we fail to sell early than I will heed the markets message.

As a side note, the 200day moving average for the cash market comes in at 4293 today. Also every man and his dog will be watching BHP at $34. Just some pointers for you.

XJO Daily:
Breakout and retest. Just keep this on your mind. How many times has this been hit!!!

Wednesday, 4 April 2012

Wednesday Plan

Morning All,

A mixed picture as I look across markets this morning. The Emini S&P500 sold off sharply late in the session due to FOMC comments, but the key support at 1400 was held and there was a sharp snapback. Clearly that market is in a range now from 1385 to 1420 and we seem to be bumping along in somekind of wedge like pattern. As long as 1400/1397 holds I remain bullish and would continue to buy dips. Breaks of this open up a move back down to the low end of the range to 1380/1385. Trade the levels.

Currencies are giving me real cause for concern. Firstly to the AUD. Yesterday, we saw an impulsive sell off after the rates decision as it looks increasingly likely there are more cuts ahead. AUD is now testing key support for a 3rd time and in my experience, these 3rd tests are often the prelude to a breakdown. More importantly, each move lower is impulsive whereas each bounce thus far remains corrective i.e. this is a clear downtrend.

AUD June 60mins:
The original double bottom trade I posted on Friday last week worked BUT the bounce off the low has clearly not been impulsive and a lower high has been made bang on an A=C target. Now we are retesting supports and I would not be surprised if we see a genuine break here. Simply, look for breakdown trades below this level. My friend at marketletters made a very good comment that the whole move off the top is a overlapping mess and thus most people will think this is not a genuine move lower. Well these are probably the ideal conditions for a genuine breakdown. Pls read: http://marketletters.blogspot.com.au/

EUR 60mins:
I posted this chart a while ago and I believe we have now seen confirmation of a failed breakout. The catalyst last night was these FOMC comments. Irrespective, a clear base pattern was formed and price failed to move higher. This is a bull trap. Last nights sell off was strong and there has been no bounce thus far. You cant manipulate currencies as easy as stocks. I think this is the prelude to a new trend lower back down to those recent lows. I believe this is bearish for other risk assets.

A Shares 60mins:
I have not updated my A shares 60min chart here for sometime. This has been one of my best calls for a while. This market is still in a clear downtrend with strong momentum. Sure there will be a bounce at some point but these should be sold. Australia's well being is completely linked to this country and market right?


And so to Australia. Today is a difficult one. There is a Head and Shoulders pattern that I am sure every trader will be looking at. I hate these patterns as so many times I see them fail to play out and actually lead to great bear trap setups. All you can do is be prepared for this if the market fails to sell.

I just want to run through the charts to try to paint a clearer picture.

XJO Daily:
Breakout above the 200day ma. We are now retesting the previous breakout zone and this ma which is natural.


XJO 60mins:
4310 to 4320 should prove good support early today as per the chart below.


SPI 15mins:
However, we are indicated at 4325 early and thus below the neckline of this H+S pattern below. Thus, this pattern will be triggered first thing. The target would be down to 4270 and the potential gap fill.

Thus, I think we could see somekind of attempted breakdown early that actually holds in. I think the better trade is to short a bounce into that neckline after the initial foray is over.


My SPI range today: 4305 to 4340. Outlier levels 4275 and 4355.

My SPI trading plan: I will be looking to BUY 4320 early with tight stops. This should be a good area of support for the cash market and I think that there is the potential for a bear trap early given this H+S pattern. Obviously if I see bearish red candles on the open, I will not hang around and get short targeting 4305/4300. My targets for any bounce out of the 20s is into 35/40 where I will look for short fade trades and more aggressive shorts.

Trade Ideas:
1) BUY 4320/25 with stops at 4316/17. Buy the weakness early into support and if it fails to hold, then we are likely to be looking at a genuine move lower. I will cut and reverse if this doesn't work, looking for 4305/4300.

2) SHORT 4335/4340. Stops above 4340. This should be solid overhead resistance and a low risk short entry.

3) BUY scalps at 4300/4305 for tight trades only. If we fail to hold here than short once more targeting 4270/80.

Tuesday, 3 April 2012

A Fresh Start

Morning All

A new month, a new p/l, a new high for the S&P500, new personal enthusiasm, and now onto the next trade. I am sitting here and smiling away to a favourite song of mine right now aptly called "NEXT GIRL" by the Black Keys: http://www.youtube.com/watch?v=x_PrT25o8Vs&ob=av2e. Its awfully cliche but this really is the tune I need right now to move on and stay positive :)


The post I put up on Friday played out very well with the S&P500 cash making a new high overnight and the DAX rallying relatively strongly off the A=C low: http://swingtradersedge.blogspot.com.au/2012/03/month-end.html.

Emini S&P500 15mins:
This was the setup I put up on Friday. We saw the breakout above the downward sloping trendline and last night we tagged the target area. We did fall a bit short of the previous highs at 1420 whereas the cash did make a new high. Is this signalling divergence?

What is the next trade? In the short term, we are trading at the top end of the short term range in the S&P500. This could also be somekind of 3 Indians/ending wedge although I personally think this is more likely a consolidation pattern before another genuine push higher up to 1440/1450.

S&P500 Cash 15mins:
This is the chart that concerns me in the short term. We are no doubt approaching some solid resistance after a strong 2 day run up. I think it is possible we see one more push higher into the 1420s and I will be on the lookout for potential bearish reversal candles.
\
The Emini S&P500 has sold off back into some supports. Thus I think the trade here is to look to buy once more around 1407/1410, stops below 1400, looking for a swing back up to 1420/1425. If we see real bearish reversal candles out of that zone than perhaps it is time to short.

Emini S&P500 15mins:

To Australia. Yesterday was a impulsive trend day lower. I havent seen a bearish day like that for a while. It was a classic gap up on euphoria and dump. Note that this happened right at the top end of the range after a clear 5 wave advance. Thus I think that we have put in a short term tradeable high and will be looking for fade trades in the next 24/48hrs in this market.

XJO Daily:
Bearish reversal candle right out of the top end of the range. A move back below that dotted line at 4300 would be bearish indeed and indicative of a false breakout.


XJO 60mins:
This is looking like a complete 5 wave advance with bearish divergences. These momentum divergences yesterday were a key tip off for that failed gap up. At a minimum, I would expect continued weakness throughout the week back into 4300.


SPI 5mins:
Yesterdays sell off was IMPULSIVE. We opened on the highs and sold off all day, closing on the lows. Thus I think the highest probability trade is to look to short this morning gap up into resistance levels. 4360 to 4370 should provide good short entries early.


Todays RBA interest rate decision at 2.30pm will obviously be the main event. The market has priced in no rate cut thus any cut will obviously be taken as a major positive for equities and bear this in mind.

My SPI range: 4330 to 4370. Outlier levels 4305 and 4380 on the upside.

My SPI trading plan: I will be looking to use this gap up early to get short into resistance levels. The bigger picture trend is up but I believe we have seen a climatic short term reversal. Using gap ups into resistance levels is a great low risk short fade setup. If we fail to sell, then look for possible breakout trades above consolidation to get long.

Core Ideas:
1) SHORT 4360, stops above 4365

2) SHORT 4370/4375. I am not sure if we will trade up this high but if the first fade level doesn't work, I will look to short this level more aggressively. Any move back above 4380 would clearly prove me wrong.

3) BUY a retest of 4330 and yesterdays low for a long scalp only.

Thanks
Austin

Friday, 30 March 2012

Month End

Morning All

In my recent posts, I talked about taking some time away from the markets to re-group and relax. The feedback I have received has been overwhelming. Its great to hear other peoples stories and situations. Pls read through the comments field over the last 2 days as there is some fantastic personal accounts. I feel so much better having voiced some things and trying to focus on some new directions.

I thought I would share some setups here today. I will not be trading these with any size BUT the setups look very clear to me and I am sure there are many who could benefit from this. Equally, I just want to put my analysis out there to prove to myself that I do have an edge.

Bottom line, I see a tradeble short term low in place. I believe in the next few days we will see a good bounce that will take us back up to the highs in some markets. No doubt, this coincides with month end "window dressing" so please be prepared for all kinds of shenanigans.

Firstly to the S&P500. Last night I talked about shorting the Eminis in the 1400/1405 region and looking for a low in 1380/1385: http://swingtradersedge.blogspot.com.au/2012/03/morning-thoughts.html.
The high was made at 1404 and the low was put in at 1386.50. I think we will now see a continuation of this move higher back up to 1415 and possibly higher.

Emini S&P500 60mins:
Low right on the 38.2 Fibonacci retracement. A higher low has formed which is bullish. I think this completes a potential ABC type flat pattern with a move higher coming. The Daily trend is still very much up.


S&P500 60mins:
You can see this higher low and potential flat/triangle type pattern forming here.


Emini S&P500 15mins:
This is the clearest chart for the short term trader. Failed breakdown through 1394/1395, bullish divergences in place and a strong rally into the close. Get long down to 1394, stops below 1385, add to the position if we see confirmation of a breakout above this trendline in the 1400s. There are only so many times a market "tests" a trendline before it gives way. Once its obvious, it will no longer work. Thus I anticipate a breakout


For confirming evidence, we have the DAX in a perfect low risk BUY zone.

DAX 60mins:
ABC off the top into the 61.8 fib retracement and the gap target. Obviously the sell off looks "sharp" for now but that is how C waves are supposed to look. Bottom line, if it is going to turn it will be right now. Look on a Daily chart and you will also see a perfect hit of the Daily trendline.


The AUD is also right in the buy spot with a retest of its recent lows. I have no idea if this does actually double bottom but it is right in the zone for a bounce with a failed breakdown last night.

AUDUSD June 60mins:


To Australia. Simply I think you have to be looking to buy this first retest back into the previous breakzone. This is 4330/4325 in the SPI.

SPI 15mins:
Yesterdays low was 4340 and we are indicated there this am. I think it is possible that we see a bit of early weakness and look to get long into the BUY zone labelled here.

Also note that most of Asian markets were in free fall yesterday with the Hang Seng and China registering -1.5 to 2% falls. However, the SPI was rangebound and held in with only a small sell off late in the day. I think this is indicative of underlying strength.

XJO 15mins:
This is a simple chart to me. A clear base pattern below 4310/4300 and breakout. I think you have to focus on this uptrend as long as 4310/4300 holds. The targets are 4350 (which was hit yesterday) BUT more importantly up at 4380. Note I think that we are also in somekind of 4th wave type consolidation pattern.


My SPI range today: 4335 to 4385 (bullish I know). Outlier levels 4320/4325.

My top ideas:

i) BUY a retest of 4335/4330. We are indicated at 4340 early which is yesterdays low. If we see an early break, I will look to get long into the low 30s, tight stops.

ii) BUY a deeper pullback to 4225/4220. If the initial support zone doesn't hold, I think you have to try one last time to get long into 25/20. Stops below 20. If we break through here, we are indeed a lot weaker than anticipated so be prepared for a breakdown/trend lower

iii) SHORT FADEs at 4262/4265. This zone was offered yesterday and look to get out of any initial longs into this zone. I will short fade here for scalps only. I will then flip to breakout trades targeting the 80s if it does break but I obviously have no idea if it will.

Good luck
Austin

Thursday, 29 March 2012

Morning Thoughts

Morning All

It was great to get so much feedback on yesterdays post. Honestly, thank you very much for the comments and it really is interesting to hear about other traders experiences and personal journeys. Sometimes it is a good thing to just let things out and voice situations. I had some of the highest hits I have ever received in yesterdays post so no doubt relating personal experiences rather than just trading setups strikes a chord with many. Here is the link for yesterday if you didn't read:  http://swingtradersedge.blogspot.com.au/2012/03/relax.html

I intend to keep narrative to a minimum today. I wanted to write something however given the interesting moves that happened yesterday in Australia as well as overnight in the S&P500.

The sell off in the S&P500 was sharper and deeper than I anticipated. Is this a sign of a more meaningful high and pullback? Note that the recent high was made on euphoria regarding comments from Ben Bernanke and the potential for more easing. That's how highs should be made- on bullish euphoria. However, also note that we are approaching month end and end of quarter- in my experience, I would anticipate a lot of "window dressing" into this period i.e. a potential rip fest.

Looking at the charts, I can see a few setups.


Emini S&P500 15mins:
Last nights 1405/1407 support zone did not hold and we saw quite a sharp thrust lower. This erased almost all the gains post Ben Bernankes speech which is bearish. However, the low was put in right on an upward trendline and ABOVE the 1385 zone i.e. a higher low. Thus I think the trade here is to sell a retest of 1405 with tight stops, flip to long if we see strong candles above this zone. I would BUY a retest of 1385/1380.


SP500 Cash 60mins:
It is quite difficult at this juncture. I could count this a complete 5 wave advance into the high with a double top pattern with bearish divergences. However, the clear alternative would be somekind of ending wedge type/3 Indians pattern with a further grind higher. It is a bull market and thus you just have to be prepared for this trend to continue.

SP500 Cash 60mins Count:
This is the one for the bears. Clear overthrow of the upper trendline which is indicative of a climatic top. Too early to call it but must be noted.

EURO Futures 60mins:
This is one of the most interesting patterns I am looking at right now. Remember Europe? This is a huge base pattern for the EURO under the 1.33 neckline (futures) and it is trying to breakout. Any failure to do so would be indicative of a FAILED pattern and bull trap. I think any move under 1.3250 would be bearish indeed.

To Australia, Strong breakout yesterday above 4300. Finally. However, how many false breakouts have we had both up and down? Bottom line, I would buy the first retest and if this fails, flip to short for a false breakout. Binary but it is what it is.

XJO 60mins:
Clear breakout above resistance. However, this market is just so frustrating. Could we be looking at a complete 5 wave move off the recent low to trap the bulls? I just don't know. BUY the first retest to that previous resistance zone first.


XJO 15mins:
Note that there was no real pick up in momentum behind yesterdays move. Certainly a reason to be cautious.

MY SPI range: 4320 to 4360. Outlier levels 4300/4305 and 4380/85.

Trade ideas:
1) BUY a retest of the neckline at 4330. Stops 4325

2) BUY a retest of the lower end of the neckline and fib retrace at 4320/4322. If this cannot hold, look to flip to short and look for the potential failed breakout.

3) SHORT a retest of 4360.

Wednesday, 28 March 2012

RELAX

Two days in a row I have let good trading days slide into negative ones. Analyzing these days, it is clear to me that I have let emotional and personal problems get on top of me. These manifested themselves in some reckless trades, a loss of discipline, and has no doubt left me thinking "how could I be so stupid?" The solution is probably clear- time to relax. Time to breathe. The market will always be there.

These are not losses that will take me out of the game. However, I am more upset at myself given the progress I have made throughout the month in my day trading only to watch it vaporise as we draw to the close. I am upset at the lack of professionalism. Does this sound familiar to anyone? As traders, I am sure we all go through this. And this is why trading is just so difficult. It puts you on the spot everyday as a performance field. If you are not prepared, if you dont bring the right mindset, you will get found out.

As this is my blog, I feel I can write this. The simple truth is that I had my heart broken by someone recently. There I said it. You know that feeling- the regrets, the anguish, the sleepless nights. It is truly horrible. I wish I could just get these thoughts out of my head but you can't will them away. The whole experience can't be explained. I know I am too intense as a person and thus this all boils up.

A friend of mine used to say to me "it's horse time" whenever I was down money. This is one of those times no doubt although not in the trading sense. Time to really get some exercise, focus on my hobbies outside of trading like surfing and music. All the old cliches of "it takes time" ring true and you can either wallow or just try and battle on.

So no charts today. No analysis. I do intend to go over my trading diary today for the month past. Pour over the good, the bad, and the areas for continued improvement. Give it all voice. I just need to get my freshness back before I can trade effectively once more I feel.

I'm sure this is something all traders can do more of. Taking time away from screens, focusing on hobbies, spending time with loved ones and friends etc. Recharging. Trading truly is a performance field and you can get found out very quickly if you are not on your game.

I would be intrigued if some of these words resonate with my readers. How do you bounce back whether it be in trading or in life?

Thanks
Austin

Tuesday, 27 March 2012

In Ben We Trust

Morning All

Yesterdays breakout trade in the Emini S&P500 played out perfectly. By now I am sure everyone realises that the real move begins about 2 hours before the S&P500 cash open. I don't think you have to be a genius to figure out why this happens.

I got out of my long position from the 1380s into the previous highs at 1408 this morning, only to watch stops go off and a further surge into the close. Hindsight is always a great thing but I try to remind myself that I am a Trader and not a Fund manager. Here are the details of the swing buy position as it played out over the last few days: http://swingtradersedge.blogspot.com.au/2012_03_23_archive.html AND http://swingtradersedge.blogspot.com.au/2012_03_26_archive.html. I always like to go over all my trades to internalise successful patterns as well as identify things that just aren't working for me. I had been fighting this market for a while previously and clearly I was wrong.

The headlines today will all be about the Bernank today but clearly these setups and patterns all appeared before any "catalyst" came. This is why I use the technicals. I always stress this. You just have to anticipate.

Emini S&P500 15mins:
Last nights breakout trade to add to initial positions.


So where does this leave us now? Obviously it is difficult to make a forecast here given the strong move overnight and the frothy sentiment levels. However, I think you just have to keep on focusing on this uptrend. I really don't have any targets/meaningful resistance until 1440/1450. The FED couldn't be more clear that it will do all it can to keep liquidity awash and keep a bid to risk assets. I have tried to fight it at points and it just doesn't make for good trading. Of course at some point the whole things unravels but the market is sending a loud message it doesn't care. Also remember that we have managed to shrug off all weakness despite quite a serious turn date.

To the charts:

Emini S&P500 60mins:
It seems I made a mistake by getting out of my long trade. Clearly we have broken out above previous highs and thus I think the best trade here is to BUY a retest back to 1410/1407, stops under 1400.


Now I don't want to get ahead of myself here, but this is the weekly chart I have had on radar since the 1370 level broke to the upside. The next meaningful target zone to me is 1440/1450.

S&P500 Weekly:

What makes me concerned? Certainly one could count a possible 5 wave move almost complete off the recent lows. Also note that the DOW Industrial have not made a new high yet although I believe it is only a matter of time before they do. Furthermore, clearly sentiment is as frothy as I have seen it which never makes me too cosy.

S&P500 Cash 60mins:
This is in the back of my mind and not tradeable for now unless we see a real meaningful reversal.


To Australia. I came in bullish yesterday and got some of the initial move to 4300 only for the rally to be shot down. I failed to recognise this underlying weakness intraday and certainly my market bias effected my trading. As a day trader, you just can't have a bias and I continue to learn this day by day. In particular, the Australian market has had these amazing ability to frustrate bulls and bears alike so being flexible is paramount.

Today I could make a case for a strong breakout. I could also make a case for a pop and drop. Nice and binary hey.

SPI 15mins:
Key res level today is 4330. Breaks of this open up targets to 4348/4350 with 4380 a big outlier level. Note that I could easily label this a 3rd wave up move but we would need to see genuine strength for this to be the case.


XJO 60mins:
Here are a host of resistance levels the XJO needs to overcome for a "breakout". Bull markets climb a wall of worry and this certainly is a wall indeed. However, the more times this tests these levels, the more likely it is to actually breakout.

My SPI range today: 4310 to 4350. Outlier levels 4305 and 4380

My SPI day trading plan: We are indicated at 4320 early and thus almost right at the previous contract highs at 4330. I think any early dip down to 4310/4305 would be a gift to get LONG with stops under 4300. On the upside, clearly 4228/4330 is the short term target and aggressive traders could fade this early with very tight stops especially given the size of the early morning gap. After the intial 30mins of trade, I will look for strong 5min candles above this 4330 level to get long for a breakout, targeting 4350 and possibly beyond. We will soon know early if this is going to be a genuine move higher or a pop and drop scenario.

Trade Ideas:

1) BUY 4310 early. Stops under 4305. Yesterdays resistance was 4305 and I think 4305/4308 should now act as a decent support level.

2) SHORT FADE 4330/4335. Very tight stops. I will not hang around with this one but I think you have to look for a short fade into the previous highs in case there is no follow through. Be prepared to flip to long if it doesn't sell to join the trend higher.

3) BREAKOUT TRADE above 4330. I will be looking for somekind of consolidation pattern/range in the first 30mins to hour of trade under this 4330 level, and then I will buy a strong 5min candle above this zone.