Morning All
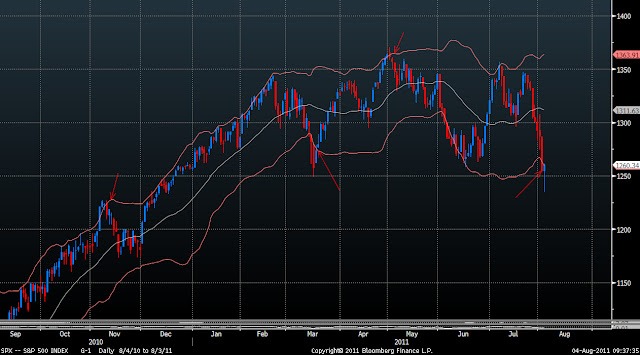
I was looking for a climatic low in the S&P500 last night and we got it, although someway below my ideal levels. Unfortunately, these overshoots are what can happen in panic situations and these type of junctures. No matter. We had an extreme volume event with 1.2bln trading on the NYSE which is the highest we have seen since this market topped. Price traded down on the open and broke through the 1250 level but reversed in the first hour of trading, closing up on the day. This is a classic bear trap. Also note that many technicians are calling a "confirmed Head and Shoulders" and neckline breaks etc. All this after a 100pt move off the high! These are the worst trading patterns and indicative of a bearish extreme.
S&P 500 Daily:
A hammer right out of the previous March lows and 38.2% retracement off the 2010 low. Hammers after such a steep decline are one of my favourite trading setups for a short term long swing.
S&P500 Daily ii
Note the clear overthrow of the Bollinger band and the close back inside. This is a buy signal and indicative of a panic extreme.
S&P500 Daily iii
This is the H+S pattern every blog has been showing of late. This is a classic bear trap as the pattern triggered last night only for price to rip back into the bears faces.
Thus in the short term I do believe we have seen a tradeable low. Price could retest last nights low one more time before the genuine bottom but that is not my primary view. I am looking at a target of at least 1280+ in the next couple of days.
Thanks
Austin


