My 2007 parallel scenario continues to provide a very accurate road map.
S&P Daily 2007- the move from the high
As you can see, the market had one more retest of the lows before a genuine bottom could be formed and a 2/3 month counter trend rally ensued. I have marked on this chart where I think we are at.
S&P 500 Daily Current
We have seen a clear topping pattern for a Wave 4 top. Any bounce up to 1170/1180 over the ensuing days is a great shorting opportunity for a move back down to the lows. Markets often need to "test" their lows before a new trend can begin.
The underlying breadth certainly seems to support this outlook. Volume has been less on this decline since the Wave 4 top and the highest number of declining issues etc was during the Wave 3 down.
In Asia, the SPI futures were 10pts short of my first target at 4055. The ending diagonal and failed breakout was a great bearish pattern. I think there may be one more move down to come into the green boxes cited (the 61.8). I do not think we will trade as far down as the lows. Be ready to buy the stocks you like for the big long swing.
SPI Futures Day Session 60mins:
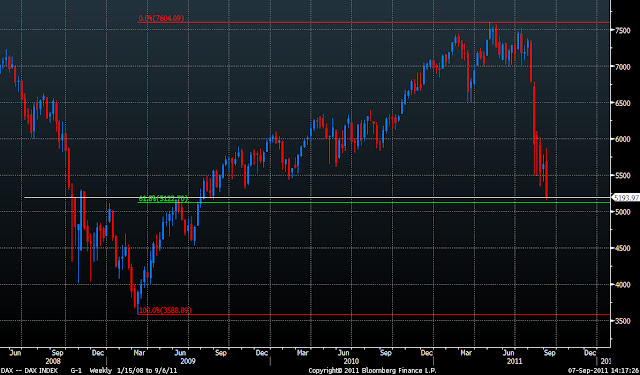
The heart of the current crisis lies in Europe. The DAX is no doubt the bell weather of the region and this market is now approaching a key support level. Just as the SPX bottomed at the 38.2 retrace and the ASX200 at the 61.8, the DAX is now approaching the 61.8 right when fear and panic are at a fever pitch. This is one of those moments when you have to be prepared to get long and do the uncomfortable thing.
DAX Weekly:
The 61.8 retrace and key pivot line.
DAX Daily:
The 61.8 comes in at 5120. There is also a clear 3 wave push pattern into this level- an ending pattern.
In sum, the markets seemed to catch a bid last night after the US hols. I think this bounce will present one last good shorting opportunity for the nimble. Look for the bigger picture long swing trades at the DAX 5100/5125 level, ASX 4050/4000, S&P500 1102/1090. These should be formidable supports in coming days.
Thanks
Austin


