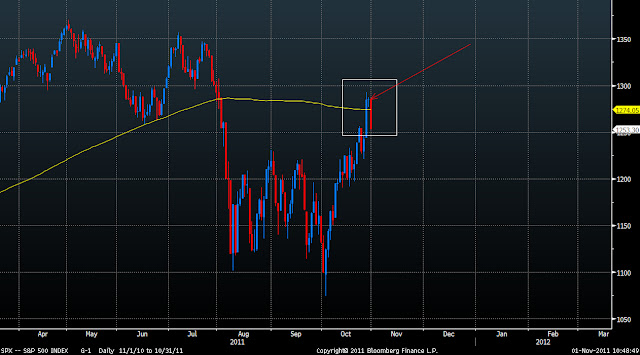
Since I last posted, the market slightly overran my 200day moving average targets. However, given the price action over the last 2 sessions, I have increasing conviction that we have seen a meaningful high, a high that may even mark the end of this Intermediate rally. I just don't see a good risk/reward trade being long up here.
I have lots of interesting charts here. These are predominately US/European charts. The setups look clearer to me overseas. It is a shame as I predominately trade Asian Indices but right now the world is being driven by these regions so we have to be on the front foot.
S&P500 Parallel
Lets being with my parallel chart that has guided me so well throughout. We have seen the sharp snapback rally post the double bottom squeeze. In 2008 the market topped right at the 200 day moving average as shown. And now, the S&P 500 hit that same 200 day moving average on Friday and has now reversed. If this plays out, there is a long way down.

S&P500 200 Daily:
The S&P overran the 200day but has swiftly reversed. That reversal candle is bearish indeed.
DOW Full Moon
I thought this was interesting also. I have often commented here that full moons are associated with market turns. The white lines on this chart show the date of the full moons over the past 7-8 months. Note how the market weakened significantly on most occasions post the full moon. Eerie. Yesterdays action could be a sign of things to come.

EURUSD Daily:
A very bearish reversal candle right out of the 61.8 Fib and the 200day. The EFSF rally lasted a whole 3 days and has been completed reversed! Not a major vote of confidence. A potential C wave could well be underway now and this will be sharper than the initial decline.
Italian Bonds vs SP500
They say that the bond market leads risk assets. Here we have Italian Bond Prices in white, SP500 in orange. Well this chart shows a clear divergence between the two. Why are European bonds continuing to fall despite this bailout package? Are equities factoring in whats going on under the hood? Not healthy at all. Expect this Gap to contract i.e. S&P500 to stage a major bearish reversal.
The major issue I am grappling with is the concept of time. This rally has reached my price targets very quickly across markets. I thought it would take a lot longer for this rally to play out and perhaps we do need more time before calling a top. Has all the bearishnesss evaporated already? Seasonally, we are coming into a strong time of year and this throws me off somewhat. However, price is of primary importance and we are firmly in the sell zone.
ASX200 Daily:
Australia has rallied right into the overhead gap and target. Price has confirmed this resistance with some bearish reversal candles. Once again, we led our overseas peers for the recent high. Also note the 3 wave nature of the bounce right into the top end of a channel. A great shorting opportunity in the coming days with stops back above the recent highs.
In sum, there is a lot of evidence to suggest that this whole Intermediate rally is over. I am often early in my market calls but that is the nature of trying to pick favourable risk/reward areas. Much as I positioned for the low, I am now positioning for a dramatic high. If this plays out, it will be a huge trade. In the very short term I think we will get a bounce and I will be using this to put on small shorts. I will add if I see more confirmation.
Good luck
Austin


