Tuesday, 12 April 2011

Asian End of Day Summary

Evening All, 

What a day and finally my patience seemed to pay off. I have been stressing for a while that position traders should be out of the market at these levels and looking for the next setup with a better risk/reward. It took almost a week to get up to the 5000 level once we broke 4900, and yet in one day this is all wiped out. The irrationality of the crowd.

Today was a solid distribution day. The XJO put in a bearish engulfing candle right at the previous February highs. I am still looking for a deeper pullback into the Daily moving averages in the coming days to get long once more for a bigger swing up as per my post on the weekend: http://swingtradersedge.blogspot.com/2011_04_10_archive.html. I do not think this is a one day wonder.

ASX200 Daily:

SPI June 60mins:
4800 looks like an interesting area of support with a former gap up and the 38.2 retrace level. 4900/4902 is short term key support and look for breaks of this down to 4800.


For Day Traders, there certainly was some good money to be made today. Firstly we had a clear Ending Diagonal pattern or 3 wave push pattern coming into today. Note this nailed the 5000 psychological level. We gapped down, tried to take take out the intraday high but failed, and then broke the morning lows leading to a strong trend day down. My mistake today was covering in the 40s at support which is the wrong play on trend days- we have to be willing to hold to the close to gain maximum benefit. This happens time and time again.Continue to look for consolidation patterns to get back into the downtrend.


SPI 5mins Ending pattern:

SPI 5mins gap down setup:
Study these gap plays. These need to become a staple if you want to successfully exploit the Asian intraday moves. Wait for the first 10mins to trade, define the range, and then trade the breaks of the levels for increased momentum. A failed rally this morning out of the gap down was a key lead indicator. 


If you are interested in receiving more of these setups and charts as they happen- LET ME KNOW. I am happy to send these via email etc. I am trying to call out levels etc on twitter and I hope this has been of value.


Today's sell off across Asia has opened up a number of retracement trades I have been waiting for:

MSCI Singapore Continuous Daily:
Has now entered into the key pivot and the Daily moving averages. We made a new momentum high and have now traded from high to low on 2 consecutive days. Looking to get long here on a lower timeframe reversal bar.


Hang Seng Daily Cash:

Has now traded right back to the breakout level. This is a great low risk/high reward entry with stops below the gap at 23,600 to 24,000.

Hang Seng Cash 60mins:
We are retracing into an open gap and the moving averages after a momentum high. Look to buy this pullback. 


I certainly took a hit on my China position. However, price is now retesting the breakout level and the bullish scenario remains as long as the recent gap up and breakout area holds:

FTSE Xinhua China A50 60mins:

In sum, I believe this is the beginning of a deeper retracement in the SPI/XJO. 4900 is short term key support and my buy zone is down at 4800. I will keep trading the short term day setups until I see a clear longer term postion trade. Singapore, Hong Kong and China are all testing key breakout levels and I think they offer low risk buy entries with confirmation. The Nikkei held the 9550 key support level today and the range remains 9550 to 9800. I have moved my stop right up on my open short.

Pls pls give some feedback if you are enjoying some of this work
Thanks
Austin

Monday, 11 April 2011

Currencies

Happy Monday,

Everyone is talking dollar dollar dollar. This is no surprise given the USD break to new lows on Friday night. The 1.4250 EUR breakout level I highlighted post the ECB meeting proved to be a great entry level: http://swingtradersedge.blogspot.com/2011/04/eurusd-whats-trade.html. It seems to me that the USD double bottom trade is now off the table with EURUSD now in breakout stage. However, I would like to draw your attention to the 2 following charts which show a strong area of resistance right here.

EURUSD 60mins:
Price is now rallying right into the top end of the range. The trend is up on all timeframes but momentum has not followed through. This is not the time to be initiating new longs as a trader I believe unless you are a trend follower with wide stops.

EURUSD Weekly
Price did close strongly above the downward trendline. However, price has now rallied into the 61.8 retrace level and the mid line of a picthfork I have been following. 1.45 is the level.
To me, there were 2 clear trades in EUR recently:
i) Buying the inital breakout above 1.4250 after a clear consolidation pattern: http://swingtradersedge.blogspot.com/2011/04/us-market-summary.html
ii) Buying the retest of the 1.4250 breakout level post the ECB meeting:

These trades are now done and it is really important to understand this. It is no good cursing the missed opportunities and then blindly entering the market. We must always "think"  correctly and we must always look for good risk/reward setups if we want to succeed consistently as traders. Right here there is no trade to me. If already long then tighten up trailing stops; if looking to get long then wait for a clear consolidation pattern once more. This is a valid resistance zone and no doubt sentiment is reaching a fever pitch.

The USD index broke to a new low on Friday night and thus invalidated the double bottom setup. Certainly this could still be an ending wedge or a bear trap but it is important to focus on the trend and the price action. Those wanting to pick bottoms should only get long above the key 77 level (June contract).

DXY June Daily:


AUDUSD has had a stellar run since breaking the 1.03 level. This market consolidated for some 5/6months and ranges like this beget strong price expansions. Don't fade this especially given the momentum expansion. Potential targets are 1.08 and then 1.10 based on projections from the consolidation pattern. I continue to look for buy setups on the lower timeframes to join this move

AUDUSD Daily:


AUDUSD 60mins:


The British pound is building an interesting pattern around the 1.63 level. Should 1.6350 lift, this could be a very strong cup and handle pattern implying a strong move indeed. For now, GBP is still in a short term range and we need more confirmation.

GBPUSD Daily:

In sum, EURUSD is rallying into a confluence of resistance levels and the USD doomsayers are all out in full force. These are the kind of areas where following your trading plan is key. Whats your setup and is the stop appropriate for this play? AUD is the strongest cross to me especially given we are in blue sky territory with little in the way of obvious resistance levels.

Thanks
Austin


Sunday, 10 April 2011

Weekend Observations

Happy Weekend All,

I will be dealing with the Eminis and the USD in another post. Here I wanted to update the swing setups and scenarios I am following in Asia. The weekend is such a great time to get prepared for the upcoming week as well as analyzing previous trades and areas for improvement. I recommend it to anyone who is serious about stepping up their game.

The SPI closed at 4965 on Friday, above it's previous February highs. As I have been stressing for the past week, this is the area for position traders to be getting out of the market and looking for better risk/reward setups or focusing on the shorter term timeframes thus keeping risk minimal. No doubt the trend remains up and it is futile to fight this until we see a clear distribution pattern. However, this is a solid resistance area and we have to be prepared to get out and look for a clearer pattern whilst those around us panic into entering the market.

SPI Continuous Daily:
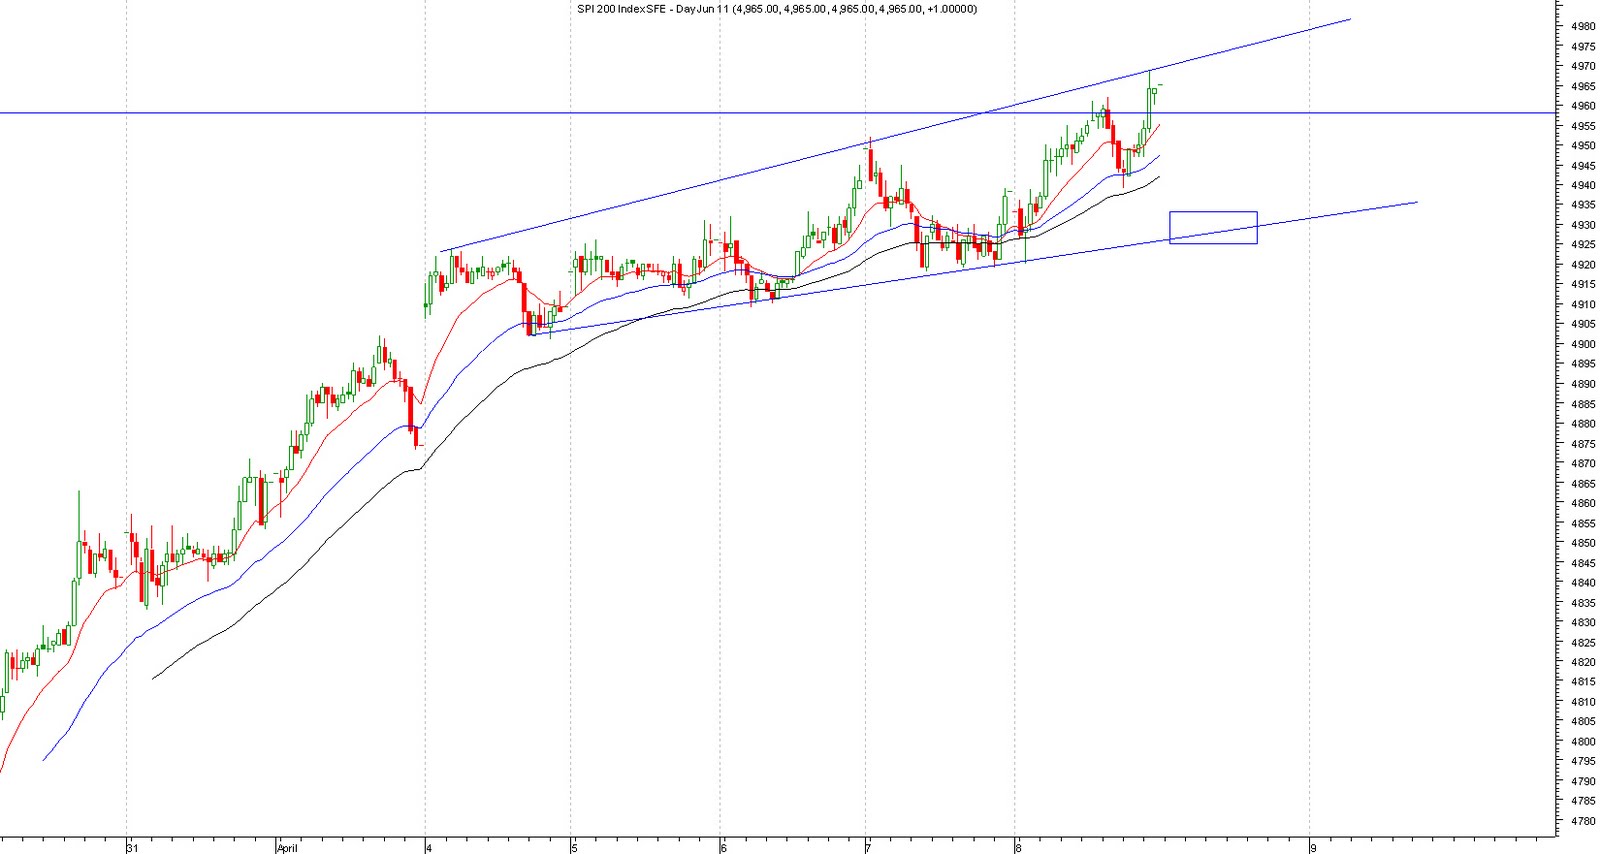
Momentum has made a new high and price has certainly been impulsive off the low. A pullback to the moving averages and support around 4800 would be a great area to get long once more for a bigger position trade. Short term SPI resistance levels are 4960 and then 5000.


SPI 15mins:
The market has been grinding higher in this megaphone like pattern for the past week. Look for breaks of this lower trendline and then 4900 to confirm a more meaningful top is in place.


The SPI night session closed at 4933 on Friday night thus there could be a 30 point gap down tomorrow right into that short term trendline shown. Day trading scenarios I am following on Monday:
i) Wait for the first 10mins of trading. Buy a 5min closing candle above the high of this opening range or short a 5min closing candle below the low of this opening range. Look to add to shorts if 4918/20 breaks.
ii) Look for a support play at 4900/4905 with tight stops. If this level breaks, expect a deeper pullback in the coming days.


The Nikkei had a strong rally on Friday retesting the 9800 resistance level. Certainly the price action did feel impulsive and the market put in a strong hammer low overnight on the 60mins timeframe. However, I am still short as my stop at 9855 was not lifted. If I see a gap down on Monday which holds, I will look to get out and reassess.

Nikkei June 60mins (night session included):


MSCI Singapore continues to grind higher with strong momentum. I still don't have a clear position trade here and am looking for a pullback to the moving averages to get long. There is a short term channel in place and if this breaks I would expect the deeper pullback to materialise.

MSCI Singapore Continuous Daily:


MSCI Taiwan showed an interesting bearish reversal candle on Friday right at previous resistance on the Daily and at the trendline resistance on the lower timeframe. Breaks of 3140 are short term bearish. There is an open gap at 3090/3100 and I will be looking for buy setups in this area to join the trend.

MSCI Taiwan Continous Daily:


MSCI Taiwan 15mins:


The strongest pattern in the region is Shanghai:http://swingtradersedge.blogspot.com/2011/03/asia-top-setups.html). I am looking to play this via the FTSE Xinhua China 50 futures. I see price beginning to breakout of a clear base pattern. 2 possible entry signals:
i) If price makes a new opening high on Monday, get long as price is making higher highs joining the momentum. This needs a wider stop but don't be afraid to buy a market as it is making new highs. This is a Jessie Livermore tried and tested technique (as well as most trend follower or momentum traders).
ii) Look for a flag or pullback to the 9900/9950 and get long on the lower timeframes on a strong bullish reversal.

FTSE Xinhua China A 50 Continuous Daily:


The Nifty has corrected in a clear ABC type pattern since hitting the 61.8 retrace level and downward trendline. The breakout from the base pattern has been strong with momentum making a new high. I think this is a clear flag pattern and will be buying if price can recapture 5900, adding above 5950.

Nifty Continuous Daily: 


Nifty Continuous 15mins: 


In sum, the best buy setups I have in the region are in Shanghai Composite and the Nifty. Australia has rallied right into its February highs and I believe it is best to focus on the shorter term timeframes up here and tighten up open exposure significantly.

Friday, 8 April 2011

Asian Morning Thoughts

Morning All,

The US markets closed relatively flat but with some wild intraday swings testing the recent range. The market remains in a clear short term range right at decent resistance levels. However, unless the low end of this range breaks in the next 2 sessions, I believe we may see a strong breakout to the upside. I have seen these kind of setups time and time again over the last 2 years and more often than not, it has paid to follow the higher degree bullish Daily trend. Often I have been on the sidelines waiting for a bearish break that doesn't materialise. Breadth and momentum have clearly been waning but this market is consolidating in time rather than price. As ever, wait for confirmation from price and trade accordingly.

Emini June 15mins:
Key supports are 1323/1324 and then a major pivot at 1320. Resistance remains 1334/1335


The SPI is indicated at 4933. Yesterday we saw an interesting gap up and failure right at the previous Feb highs. Similar to US markets, we remain in a clear short term range right at significant resistance levels (i.e. the February highs). I have been advising caution for position traders at these levels and I don't see any evidence to change this stance yet. The Materials Sector made a new high but there has been no follow through yet, setting up a possible bull trap. The Financials sector closed with a Doji star yesterday at the top end of the range. These are warning signals and not short signals. I do believe the strongest play is to wait for a deeper pullback to the Daily moving averages for buy setups.

Day trading scenarios I am following today:
i) Look for a retest of 4945 to 4950. Short if there is a clear reversal candle out of these levels, stops above 4952.
ii) Buy support at 4902 with very tight stops. If this level breaks, short for a longer term swing lower


Materials Sector Daily:

Financials Sector Daily:


I remain short the Nikkei for the reasons posted here several days ago: http://swingtradersedge.blogspot.com/2011/04/nikkei-june-short.html. Given last nights earthquake, there were some wild swings in the futures down to 9405 but price has recovered to 9550. We will see how today plays out when the cash market opens. Resistance levels remain 9680/9700 with support at 9400/9350.


Ill have more later in the day
Thanks
Austin

(UPDATE) EURUSD

EURUSD sold off right into my target box last night at 1.4250 and held. This was a great support play and shows the importance of following new momentum highs. This level now must hold to keep the bullish scenario intact. In the short term I am looking for a retest of the previous highs at 1.435

EURUSD 60mins:

Thursday, 7 April 2011

EURUSD- whats the trade?

There are lots of opinions flying around in the build up to the ECB announcement shortly. As ever, let price and the charts be our guide. I have 3 charts here which are very simple and show the significance of these current levels:

EURUSD Weekly:
Price has rallied right into a significant weekly trendline.

EURUSD Daily:
Price is trying to break the previous highs at 1.43. This is still a potential Double Top trade/ Bull trap if we see price  reverse here and take out yesterdays lows. Furthermore, momentum is clearly waning here and price is trading in a potential ending wedge pattern

EURUSD 60mins: 
Yesterday we saw a strong breakout of the recent range with strong momentum. Thus, our trade should be to buy the first pullback against this breakout level. Price is correcting back to this 1.425 level currently. Thus, short term traders could be looking to get long here with stops below 1.4230. I would prefer to wait for the announcement and see a bullish reversal to confirm. Any close back below 1.42 is BEARISH and would trigger the Daily Double Top pattern.


Thus in conclusion, we are at a significant juncture. The bigger picture is indicating some real resistance at this levels and a potential bull trap/double top. However, price has clearly broken out on the lower time frame and as long as 1.4220/1.4250 holds, the short term trend remains bullish. Thus, focus on the price action and use these setups to guide your trade. I am looking to buy around 1.4250/1.4230 for the support play and will be shorting below 1.42 for a bigger picture short.

Thanks
Austin

Wednesday, 6 April 2011

Eurostoxx Bearish Setup

Coming into the European open, I am monitoring a potential bearish setup in the Eurostoxx. This market is trading in a clear wedge pattern with momentum waning. Yesterdays lows at 2858 once again managed to hold at the upward trendline. I am looking to short below this level targeting 2750 and possibly lower.  These patterns imply a sharp break lower and thus if there is no follow through, look to tighten up stops quickly.

Eurostoxx 15mins:


Eurostoxx 60mins:

Asian Morning Thoughts

Morning All,

US markets tried to breakout last night but failed at their previous highs and gave up almost all gains. The Nasdaq 100 once again underperformed. We continue to build a short term range right at previous resistance levels with deteriorating breadth and weakening momentum. It appears to me that this trend is tiring and I am looking for a deeper pullback in the next 2/3 days. I cannot rule out a breakout and I will be prepared to join should price continue to correct in time rather than price over the ensuing days.

I wanted to update on the underlying breadth figures. The number of advancing issues continues to deteriorate despite price making new highs. Last night the NYSE advancing issues hit a high of 1948 but closed at 1658. Once again we have seen another lower close:

21/3/11: 2473 NYSE advancing issues
30/3/11: 2212 NYSE advancing issues
5/4/11: 1658 NYSE advancing issues

The divergences in these readings with price is often a lead indicator. Indeed, I saw the same divergences on the lows that helped me identify a possible turning point: http://swingtradersedge.blogspot.com/2011/03/us-market-summary_16.html.  

Eminis 60mins: 
There was a small reversal out of the resistance zone. Use breaks of the upward trendline or the moving averages for potential short opportunities.

Dow Cash 60mins:
The Dow is still trading at the top end of it's range and a potential Double Top trade is still very much in play


Thus to Asia. There is no strong overnight lead for early trade. The SPI is indicated at 4922 just below yesterdays highs. The key short term range is 4902/4900 to 4930. As stressed yesterday, I do not have a clear swing trade up here as we are coming right into the February highs. For my day trading, I think today could be another range day. I am looking for breaks of 4930 to target 4945/4950 and I am also looking to buy supports. The ASX200 Cash high is 4944 and this appears to be the "obvious" target.

SPI June 15mins:
Look at this chart. Often the best trades are just the simple ones- look at how price has respected the moving averages continuously. For now, there is no need to fight this until we see a clear reversal or distribution process. 4900 is the key short term support


SPI June 5mins:
This is the short term range

I am still short the Nikkei for all the reasons posted yesterday. We are indicated slightly higher and will be retesting yesterdays breakdown level (see target box). Short term resistance levels are 9670/9700 then 9750. Any more strength above these levels, then I will consider covering.

Nikkei June 5mins:

MSCI Singapore showed an interesting exhaustion candle right at the 61.8 retrace level yesterday. It is still early days but I am looking for a pullback into the Daily moving averages over the next few days to get long once more for a larger swing trade. 3700/3720 are the short term resistance levels

MSCI Singapore Continuous Daily:

In sum, I do think this trend off the low is tiring with momentum and breadth deteriorating. However, as ever, there is no need to short until we see either breaks of support, a clear reversal candle, or a turn in the moving averages. Look for these signals. This market could continue to correct in price rather than time thus we must continue to respect the underlying price action.
Thanks
Austin

Tuesday, 5 April 2011

(UPDATE) Emini S&P 15min wedge

I see a clear consolidation building here in the S&P Eminis. We are possibly finishing off the "e" leg of a triangle which implies a breakout coming into the contract highs in the 40s. Wait for price to thrust out of this support level before getting long. However, like every pattern, we must be prepared for these classic setups to fail as these are often stronger signals. Breaks of 1324/1325 to the downside are bearish and get short. Note that yesterday was an Inside Day on the cash market. Expect a break either way tonight.


Emini S&P June 15mins:


(UPDATE) I thought I would follow up on the outcome of the Emini pattern shown last night. I think this is a great example of failed patterns and how a trader needs to be completely flexbile to be successful.

We saw a breakdown of the low end of the pattern during European trade. There was no follow through to the downside and thus immeadiatly we should be looking to get long if price regains support. Failed patterns are often very strong signals as the crowd has traded on the perceived breakdown, and are then forced to cover their postions adding fuel to the subsequent rally. Personally, I never trade the Eminis BEFORE the Cash market open. This pattern here is a clear illustration of why- there are many false breaks and moves prior to the US opening.

We did see a thrust out of the 1324/1325 support level when the US stepped in and this was the initial signal to get long. Look for a strong 5min or 15min candle. There was an opportunity to add another postion when price broke above the downward trendline. However, there was no strong follow through and price failed right at the previous highs at the 1333/1334 res level. Nimble traders could have made a small profit but all in all this was rather a volatile session.

Emini 15mins:


Emini 5mins:

Nikkei June Short

I thought I would show a  trade I just executed in the Nikkei June futures. This is not a reccomendation to trade but just an illustration of my thinking. 

I have been following a potential short setup for some while in the Nikkei: http://swingtradersedge.blogspot.com/2011/03/nikkei-vs-s-flash-crash.html. Price did rally into the 9750/9800 target level I cited some days ago i.e. the open gap and 61.8 retrace level. In the last 3 days, this market has traded in a clear distribution range and has failed to move higher. I got short on a breakdown of the recent range (see 5min chart). Inital targets are 9350 with stops above 9770.


Nikkei June 5mins:
Got short at 9640 on the retest of this mornings breakdown level.


Nikkei 15mins:


Nikkei 60mins:
Price has rallied right into the open gap. Momentum divergences are appearing. The moving averages are still positive on this timeframe and thus we must be wary if there is no follow through to the downside. Note that the Daily trend is down and we are shorting the market into the moving averages.

I will keep you posted on how this plays out.
Austin

Asian Morning Thoughts

Morning All,

The SPI futures have opened at 4918 just short of yesterdays highs at 4922. Once again, I must stress that I don't have a clear trade here. I believe we are at the top end of the range and I am happy to be out of the market at these levels. Certainly yesterday's price action did feel tired but there is no clear distribution pattern yet. Patience is a key quality of a successful trader I believe and until I see a solid risk/reward setup, I will not risk my capital. Loner term, I am looking for a deeper pullback into the Daily moving averages to get long once more but here I advise caution.

I think today could be a range type day. Scenarios I am following
i) Potentially fade at 4922/4925 targeting 4905. If this res level lifts, look for potential breakout trades targeting 4940+ (target the ASX200 February high)
ii) Buy support at 4902/4900. Look to play a potential range. This level is a key marker for the short term bullish scenario.

The Australian sector indices are trading right into meaningful resistance levels. I am not calling a top here as the underlying momentum is strong, but I do believe we are certainly at the top end of the range. Always think risk/reward. Ask yourself, does it make sense to be long the market coming into these levels as a trader?

Energy Sector Daily:
This is a potential Double Top pattern in the making. Needs a bearish reversal candle to confirm. Either way, we are at solid resistance and this is NOT a breakout trade given the lack of consolidation.


Financials Sector Daily:
The Financials are now retesting the top end of this broad range. The last breakout was strongly rejected.

Materials Sector 60mins:
The materials sector is now right back to its previous highs. This is resistance


Therefore, I advise caution here in Australia. We are trading at resistance levels and we must respect this as traders. Look for either short term topping patterns to get short or wait for longer term consolidation patterns to join this trend for a new swing up. Sentiment is once again getting very bullish and I can see a number of bullish recommendations flying around. Be careful in these situations.


The Nikkei is trading at the key 9700 support. Price has failed at 9800 right at the open gap. The Daily chart has left 2 consecutive indecision candles right at the downward moving averages. I am looking to get short on breaks of this range. I outlined this trade here several days ago:http://swingtradersedge.blogspot.com/2011/03/asia-top-setups.html AND http://swingtradersedge.blogspot.com/2011/03/nikkei-vs-s-flash-crash.html

Nikkei 15mins June:


The Nifty continues to move higher from the strong base pattern. Yesterday we saw a strong close above the 61.8 retrace level. A small downward trendline comes in at 6000 and this looks like a short term target. I believe traders should continue to look for setups to join this strong trend.

Nifty Continuous Daily:


The Hang Seng closed solidly above the downward trendline I have been monitoring. Note the strength we have seen since that failed breakdown of horizontal support. In the short term, the market seems a bit overextended and I would be wary of jumping in here despite yesterdays close.

Hang Seng Daily:

Monday, 4 April 2011

SPI Continous Daily

I highlighted the SPI Continuous previous high at 4922 in my morning post. Today we hit a high of 4924 and are finally selling off. Early days but this is the area for position traders to be getting out of the market/tightening up risk.

SPI Continous Daily:

ASX200/SPI Morning thoughts

The ASX has come along way since I called for a swing low on March the 18th: http://swingtradersedge.blogspot.com/2011/03/asx200-swing-low-is-in.html. No doubt I have missed chunks of this move higher as this has been a rapid recovery with only small pullbacks. Ultimately, this thrust has shown the importance of following the trend, of having a clearly defined method for trailing profit stops, and waiting for price to confirm resistance levels rather than pre-empting. Trends will often move higher and for longer than we can comprehend. Such events are important learning lessons and I believe we must go back and study the charts to gain insight as to how we can improve ourselves going forth.


I don't have a clear pattern/setup in early trade. The obvious targets for this move are the previous highs at 4958 on the June contract and 4922 on the continuous contract. For position traders who caught large chunks of this move, I would now recommend getting out of long positions or tightening up risk significantly. We have gone from one emotional extreme to the other and we must always think about the risk/reward. I do believe the bigger picture is bullish but holding onto our open profits is very important. I think now is the time to look for shorter term trades/intraday trades until we see more consolidation or a deeper pullback.


Scenarios I am following today:


i) Look for a retest of Fridays highs at 4902. If we see a clear rejection of 4900/4910, fade the move with very tight stops, look for a 15 point gain or 4875
ii) If there is no strong sell off in the first 30mins, look to buy breakouts from consolidation or buy above the intraday high, targeting the contract highs at 4922.


Res: 4900/4910, then 4922/30
Support: 4875/70, 4855


SPI 2mins: