Morning All
(UPDATE: Eminis are trading 1313 and I have just gone short, 1/2 size. This is the exact breakout conditions I was hoping for and will put on the other 1/2 if this sells off back down with some bearish 60mins reversal candles)
Well this really is it. Every single chart I look at looks overextended and perilious. I wish I had a better message but I don't. I wish I could be more positive. I have traded for many years, I have studied many price charts, and I believe this experience all boils down to these few moments. I have no idea if this will be "the top" or just an intermeadiate high, but either way I want to be ready. Tuesdays are my reversal days. If I see one more push higher today, I will really begin to position myself. Options could really be the play here.
I will keep my message clear and simple as I always try to do.
S&P500 Daily:
Surging right into the overhead resistance. I have found the mid-point of these pitchforks to often be great targets and turning points.
Nasdaq 100 Daily:
Right into the double top zone.
Dow Industrials Daily:
Also surgin right into the Double top zone. You just have to be getting out of longs into this.
S&P500 60mins:
The market continues to grind higher in a wedge with waning momentum. We could be looking at the final subdivisions of a C wave here. Note that an A=C target off the Novmber lows comes in at 1310-1317
AUD Daily:
Right into overhead resistance.
ASX200
Rally and reversal right out of the overhead resistance. I have shown here how every bounce out of the October bottom has got weaker and weaker. Our latest bounce (which I have labelled the "E" leg) is overlapping and a clear 3 thus far- not a new impulse higher.
So price is right in the zone for a pullback at a minimum. Breadth continues to diverge since December peaks as I have shown in previous posts. In terms of sentiment, I red the other day that the latest bullish sentiment reading of the AAII Sentiment Survey came in at 49.1%. This is the highest reading registered by the survey since Feb 10 2011 (cast your eye back to what happened to the S&P500, ASX200 or any equity index subsequently-collapso).
Thus, I am still in short mode. An ideal scenario would be somekind of "bullish" ovethrow or stop hunt that quickly gets sold into come Monday night. I am sure there are many out there who are now saying this is a "breakout" above 1300- puurrrlease.
My SPI Range today: 4190 to 4225. Outlier levels 4180 and 4235
My Day Tradig Plan today: Modays are always tought to call. AUD has opened small positive which gives us a positive lead. We have solid res in the 4230s and I will continue to short this with tight stops. Any move above there could trigger a potential "breakout" and I will have to join although I do believe this will be short lived. Support comes in around 4190 to 4200, and I will look for scalp longs there only.
SPI 5mins
Twitter Feed
Monday, 23 January 2012
Friday, 20 January 2012
Morning Plan
Good Morning All,
Yesterday was a great trading day in Australia and finally we saw the bearish reversal I had been anticipating. I stressed the importance of an immediate sell off if this was to be the real deal, and we got it.
XJO 5mins:
Matched higher due to offshore lead, made a high in the first 10mins and then sold off all day. The press will tell you that the unemployment number led to the weaknesss, but the truth is that by the time the number actually came out, the sell off was already well advanced. The market actually had a good bounce post the number!
Yesterdays price action confirms to me that we are on the cusp of a significant turn in Australia and we now have great markers to place stops. Given the US session overnight, the SPI is indicated at 4225 which is not far off yesterdays 4237 high. Any retest of yesterdays highs is such a great low risk short trade.
ASX200 Daily:
Strong reversal candle yesterday in Australia right on the downward trendline. I believe this completes the "E" leg of this triangle and I expect a breakdown in coming days/weeks.
ASX200 60mins:
A perfect A=C move off the low that nailed yesterdays highs. The open gap proved to be the target for the bounce as they so often are. Note the continued bearish divergences coming into yesterdays high.
You have to look to sell any retest of yesterdays highs. Great low risk double top trade.
My SPI range today: 4200 to 4235. Outlier levels 4180 and 4250
My Day trading plan today: I will look to short any retest of yesterdays highs at 4230 to 4235. Stops to be placed above 4240. Once again, this should sell off early if this is a genuine turning point. I will only look to get long if we can hold the morning gap and breakout above 4240 later in the day. There is no data today in Australia and thus no obvious catalysts.
I was stopped out overnight in the S&P500 (probably the high now :)). That's what stops are for. The grind higher continues but I do not have a trade setup to get long. I continue to believe we are very vulnerable up here but I will wait for clear confirmation before re-entering any shorts. The following charts should be very clear and simple.
SP500 Daily:
Right into trendline resistance and a pop above 1300. Now watch it drop. Tops manifest themselves when everyone least expects it and when everyone wants to be "IN".
Nasdaq 100 Daily:
Right into the double top zone. This is setting up for a great short trade (2B trade according to Linda Bradford Raschke).
Russell 2000 Daily:
Massive underperformance which is not healthy. Right into the previous breakdown zone and resistance zone. Once again, looks like a small pop and then drop.
S&P500 60mins:
Spillover of wedge pattern? Any sharp move back down through this pattern will be my short trigger
AUDUSD Daily:
Rally right into downward trendline. I have been following this count for a while, and I believe we may be seeing the final legs of this triangle and breakdown tot he downside. Rates are going one way in Australia especially given the recent unemployment numbers- lower.
Even the DAX has hit its 200Day moving average and looks ripe for a double top trade. All in all, the setups are aligning for a short trade but it looks like I will just have to remain patient.
Austin
Yesterday was a great trading day in Australia and finally we saw the bearish reversal I had been anticipating. I stressed the importance of an immediate sell off if this was to be the real deal, and we got it.
XJO 5mins:
Matched higher due to offshore lead, made a high in the first 10mins and then sold off all day. The press will tell you that the unemployment number led to the weaknesss, but the truth is that by the time the number actually came out, the sell off was already well advanced. The market actually had a good bounce post the number!
Yesterdays price action confirms to me that we are on the cusp of a significant turn in Australia and we now have great markers to place stops. Given the US session overnight, the SPI is indicated at 4225 which is not far off yesterdays 4237 high. Any retest of yesterdays highs is such a great low risk short trade.
ASX200 Daily:
Strong reversal candle yesterday in Australia right on the downward trendline. I believe this completes the "E" leg of this triangle and I expect a breakdown in coming days/weeks.
ASX200 60mins:
A perfect A=C move off the low that nailed yesterdays highs. The open gap proved to be the target for the bounce as they so often are. Note the continued bearish divergences coming into yesterdays high.
You have to look to sell any retest of yesterdays highs. Great low risk double top trade.
My SPI range today: 4200 to 4235. Outlier levels 4180 and 4250
My Day trading plan today: I will look to short any retest of yesterdays highs at 4230 to 4235. Stops to be placed above 4240. Once again, this should sell off early if this is a genuine turning point. I will only look to get long if we can hold the morning gap and breakout above 4240 later in the day. There is no data today in Australia and thus no obvious catalysts.
I was stopped out overnight in the S&P500 (probably the high now :)). That's what stops are for. The grind higher continues but I do not have a trade setup to get long. I continue to believe we are very vulnerable up here but I will wait for clear confirmation before re-entering any shorts. The following charts should be very clear and simple.
SP500 Daily:
Right into trendline resistance and a pop above 1300. Now watch it drop. Tops manifest themselves when everyone least expects it and when everyone wants to be "IN".
Nasdaq 100 Daily:
Right into the double top zone. This is setting up for a great short trade (2B trade according to Linda Bradford Raschke).
Russell 2000 Daily:
Massive underperformance which is not healthy. Right into the previous breakdown zone and resistance zone. Once again, looks like a small pop and then drop.
S&P500 60mins:
Spillover of wedge pattern? Any sharp move back down through this pattern will be my short trigger
AUDUSD Daily:
Rally right into downward trendline. I have been following this count for a while, and I believe we may be seeing the final legs of this triangle and breakdown tot he downside. Rates are going one way in Australia especially given the recent unemployment numbers- lower.
Even the DAX has hit its 200Day moving average and looks ripe for a double top trade. All in all, the setups are aligning for a short trade but it looks like I will just have to remain patient.
Austin
Thursday, 19 January 2012
Urgh
Morning All
US opens on lows, holds, rallies all day to close on highs. Urgh. I am still short the S&P 500 Eminis with stops at 1307 but its not looking good for the bears. Cant really argue with that price action. Or can you?
The IMF, ECB, FED, you name it are throwing everything at this to try and keep the juices flowing. And it is working. However, to me it is such a house of cards. As it stands my outlook has been wrong but this is what happens when you try to pick inflection points. Keep it small. I have always believed that the real money is to be made by identifying the low risk/high reward trade and pursuing it continuously. As I scan through charts today, I still view the technical situation as precarious. I just cant justify being long up here currently for a bigger picture trade. At some point this "buy the dip" recklessness stops and I guess I just have to be patient.
Let me show you my thoughts very simply:
Nasdaq 100
Market is parabolic right into overhead resistance and double top area. Can price really keep up this trajectory? You could even throw some bollinger bands on this chart to show how overdone this move is. As a trader, I just don't know how you could be positioned long up here into this.
DOW 60mins:
This is a classic ending wedge. Momentum continues to diverge vs price.
NYSE Advancing Issues
Strong markets rise with improving breadth and an increasing number of advancing issues. Not the case here. The number of advancing issues peaked in December and continues to make lower highs despite price grinding higher.
NYSE Advance/Decline:
This should be going higher in a healthy uptrend right?
S&P500 15mins:
Another new high last night with momentum not following through. Complete 5 wave advance to finish everything off?
In sum, I am still short but looks like I will be stopped. This market could keep grinding all the way up to 1325 but I really doubt it. Picking inflection points is always tough but when I look under the hood and when I look at the juncture we are at, it makes sense to me from a risk/reward standpoint.
Australian futures are indicated at 4220. If this is a genuine top as per my special update yesterday, we should immediately sell off: http://swingtradersedge.blogspot.com/2012/01/special-update-xjo-top.html. The 61.8 Fib retrace for the futures comes in at 4220 and A=C off the lows at 4230. I will be waiting for confirmation out of this zone today before putting on any shorts. This could equally be a genuine breakout above 4200 (i doubt but have to be prepared). Any sell off should find short term support at 4200/4205 and look for scalp longs there. A genuine longer term swing short should only be put on if we close meaningfully back below 4200.
SPI Continous 60mins:
US opens on lows, holds, rallies all day to close on highs. Urgh. I am still short the S&P 500 Eminis with stops at 1307 but its not looking good for the bears. Cant really argue with that price action. Or can you?
The IMF, ECB, FED, you name it are throwing everything at this to try and keep the juices flowing. And it is working. However, to me it is such a house of cards. As it stands my outlook has been wrong but this is what happens when you try to pick inflection points. Keep it small. I have always believed that the real money is to be made by identifying the low risk/high reward trade and pursuing it continuously. As I scan through charts today, I still view the technical situation as precarious. I just cant justify being long up here currently for a bigger picture trade. At some point this "buy the dip" recklessness stops and I guess I just have to be patient.
Let me show you my thoughts very simply:
Nasdaq 100
Market is parabolic right into overhead resistance and double top area. Can price really keep up this trajectory? You could even throw some bollinger bands on this chart to show how overdone this move is. As a trader, I just don't know how you could be positioned long up here into this.
DOW 60mins:
This is a classic ending wedge. Momentum continues to diverge vs price.
NYSE Advancing Issues
Strong markets rise with improving breadth and an increasing number of advancing issues. Not the case here. The number of advancing issues peaked in December and continues to make lower highs despite price grinding higher.
NYSE Advance/Decline:
This should be going higher in a healthy uptrend right?
S&P500 15mins:
Another new high last night with momentum not following through. Complete 5 wave advance to finish everything off?
In sum, I am still short but looks like I will be stopped. This market could keep grinding all the way up to 1325 but I really doubt it. Picking inflection points is always tough but when I look under the hood and when I look at the juncture we are at, it makes sense to me from a risk/reward standpoint.
Australian futures are indicated at 4220. If this is a genuine top as per my special update yesterday, we should immediately sell off: http://swingtradersedge.blogspot.com/2012/01/special-update-xjo-top.html. The 61.8 Fib retrace for the futures comes in at 4220 and A=C off the lows at 4230. I will be waiting for confirmation out of this zone today before putting on any shorts. This could equally be a genuine breakout above 4200 (i doubt but have to be prepared). Any sell off should find short term support at 4200/4205 and look for scalp longs there. A genuine longer term swing short should only be put on if we close meaningfully back below 4200.
SPI Continous 60mins:
(UPDATE) XJO A=C 60mins
Wednesday, 18 January 2012
Special Update- XJO Top?
I know I am going early, but everything is aligning here to me for a great low risk short in Australia.
The 60mins has now clipped the 61.8 Fib retrace with waning momentum. Just as we had bullish divergences on the low, we now have bearish divergences coming in right here. I belive this could complete an ABC flat off the low. Note this would coincide nicely with an S&P500 top. Everyone will be thinking that we have "broken out" from 4200. Bull trap?
XJO 60mins:
XJO 5mins:
A perfect 5 wave move into this high. Divergences also in place.
Am I going early? Sure. However, this setup is just so appealing right now. If you want a entry trigger, use a move back down below 4200 to get short.
Austin
The 60mins has now clipped the 61.8 Fib retrace with waning momentum. Just as we had bullish divergences on the low, we now have bearish divergences coming in right here. I belive this could complete an ABC flat off the low. Note this would coincide nicely with an S&P500 top. Everyone will be thinking that we have "broken out" from 4200. Bull trap?
XJO 60mins:
XJO 5mins:
A perfect 5 wave move into this high. Divergences also in place.
Am I going early? Sure. However, this setup is just so appealing right now. If you want a entry trigger, use a move back down below 4200 to get short.
Austin
A Few Lessons
Morning All,
Yesterday wasn't my finest post. Yes my view in Australia was wrong but more importantly, I really didn't outline an alternative plan or scenario should the market not sell. This was brought to my attention by my good friend at Market Letters (http://marketletters.blogspot.com/) and it is so true. If the market fails to do what you expect, what is your alternative scenario? I have always stressed the importance of being flexible and heeding the underlying price action. Fortunately, I was able to dig myself out of a hole in my day trading by stepping back and recognising the underlying strength. However, I did not make this clear in my morning report for my readers.
SPI 5mins Yesterday:
My plan yesterday was to short the 40s right at the previous days highs. However, we opened well above that level immediately and I was stopped for a small loss. Gap ups that hold and consolidate, especially above the previous days highs, are bullish. There were many buy signals throughout the day after the morning consolidation.
,
I managed to redeem myself somewhat overnight. I have continued to stress shorting the S&P500 in the high 90s with stops at 1305. On twitter last night with the market trading just short of 1300, I really stressed this:
@fkntweetme I am still in short mode. It is in the slot zone! Got to be willing to sell when everyone wants it
I couldn't have stressed it more. The market hit a high of 1302 and then gave back all its gains and more to hit a low of 1286. Is the top in? I don't know yet but once again, the market failed miserably to breakout. The trend is tired. Momentum continues to wane. And this is the perfect spot for a high.
S&P500 Emini 60mins:
I posted this double top chart yesterday. We did see a small spillover and then a sharp reversal. This is bearish to me and I remain short.
S&P500 Cash 60mins:
3 peaks are now in. Momentum continues to diverge vs price. It will take one more down day to open up some real selling
S&P500 Daily:
Sometimes you have to step back and look at the bigger picture. We are trading right into some serious overhead resistance. This is not the area that strong breakouts occur. Buying the market in this kind of zone just does not offer a good risk/reward.
Australia was strong yesterday but on light volume. The whole of Asia caught a very strong bid in anticipation of China GDP numbers. Is this a genuine move higher? I don't think we can say this has broken out and indeed the futures are indicated back down to 4177 today. My bigger picture view has been that we are within a triangle and I expect this to break to the downside. The chart below shows the targets for this rally and we are trading right in the zone. For my swing trading, I have always been of the view that you develop that low risk/high reward trade and keep trying at it until proven wrong. Well I am still happy to short this move at strategic spots until I see more evidence this is a real move higher.
XJO 60mins:
Res levels of 4200 and 4220. There is also an open gap target at 4235. Any strong close below 4200 now would confirm to me that we have seen a high (breakout and failure). Any move above 4250 and I will abandon my bearish mid term view
My SPI range today: 4160 to 4195. Outlier levels 4145/50 and 4200
My Day trading plan today: We are indicated at 4175 first thing this morning. This puts us right in the middle of yesterdays range. Despite my views that we are building a high, I have to respect yesterdays strength and we may see 1 more retest of yesterdays highs. Thus, I will be looking to buy 4160/4165 early as a long scalp with tight stops. The other area to look for long scalps is 4145. Any move below 4145 is bearish and I will join the momentum lower should this occur. On the upside, I will look to short fade 4190 and 4195 with stops above 4205.
Thanks
Austin
Yesterday wasn't my finest post. Yes my view in Australia was wrong but more importantly, I really didn't outline an alternative plan or scenario should the market not sell. This was brought to my attention by my good friend at Market Letters (http://marketletters.blogspot.com/) and it is so true. If the market fails to do what you expect, what is your alternative scenario? I have always stressed the importance of being flexible and heeding the underlying price action. Fortunately, I was able to dig myself out of a hole in my day trading by stepping back and recognising the underlying strength. However, I did not make this clear in my morning report for my readers.
SPI 5mins Yesterday:
My plan yesterday was to short the 40s right at the previous days highs. However, we opened well above that level immediately and I was stopped for a small loss. Gap ups that hold and consolidate, especially above the previous days highs, are bullish. There were many buy signals throughout the day after the morning consolidation.
,
I managed to redeem myself somewhat overnight. I have continued to stress shorting the S&P500 in the high 90s with stops at 1305. On twitter last night with the market trading just short of 1300, I really stressed this:
austinmitchy Austin Mitchum
$ES_F/$SPY- actually think tonight is the perfect conditions for a top and climatic spillover
$ES_F: Clearly trading above the double top area. However, I just know this is the area to look for a top/climatic reversal. Broken record?
I couldn't have stressed it more. The market hit a high of 1302 and then gave back all its gains and more to hit a low of 1286. Is the top in? I don't know yet but once again, the market failed miserably to breakout. The trend is tired. Momentum continues to wane. And this is the perfect spot for a high.
S&P500 Emini 60mins:
I posted this double top chart yesterday. We did see a small spillover and then a sharp reversal. This is bearish to me and I remain short.
S&P500 Cash 60mins:
3 peaks are now in. Momentum continues to diverge vs price. It will take one more down day to open up some real selling
S&P500 Daily:
Sometimes you have to step back and look at the bigger picture. We are trading right into some serious overhead resistance. This is not the area that strong breakouts occur. Buying the market in this kind of zone just does not offer a good risk/reward.
Australia was strong yesterday but on light volume. The whole of Asia caught a very strong bid in anticipation of China GDP numbers. Is this a genuine move higher? I don't think we can say this has broken out and indeed the futures are indicated back down to 4177 today. My bigger picture view has been that we are within a triangle and I expect this to break to the downside. The chart below shows the targets for this rally and we are trading right in the zone. For my swing trading, I have always been of the view that you develop that low risk/high reward trade and keep trying at it until proven wrong. Well I am still happy to short this move at strategic spots until I see more evidence this is a real move higher.
XJO 60mins:
Res levels of 4200 and 4220. There is also an open gap target at 4235. Any strong close below 4200 now would confirm to me that we have seen a high (breakout and failure). Any move above 4250 and I will abandon my bearish mid term view
My SPI range today: 4160 to 4195. Outlier levels 4145/50 and 4200
My Day trading plan today: We are indicated at 4175 first thing this morning. This puts us right in the middle of yesterdays range. Despite my views that we are building a high, I have to respect yesterdays strength and we may see 1 more retest of yesterdays highs. Thus, I will be looking to buy 4160/4165 early as a long scalp with tight stops. The other area to look for long scalps is 4145. Any move below 4145 is bearish and I will join the momentum lower should this occur. On the upside, I will look to short fade 4190 and 4195 with stops above 4205.
Thanks
Austin
Tuesday, 17 January 2012
Emini Double Top
Update
I was tragically wrong in Australia today as I didn't expect such strength. However, this rally has taken the S&P500 Eminis right into the double top area. I view this as a great risk/reward SHORT with stops above 1300. You just have to be willing to short when everyone wants it into these kind of zones
S&P500 Eminis 60mins:
I was tragically wrong in Australia today as I didn't expect such strength. However, this rally has taken the S&P500 Eminis right into the double top area. I view this as a great risk/reward SHORT with stops above 1300. You just have to be willing to short when everyone wants it into these kind of zones
S&P500 Eminis 60mins:
More Pain in Asia to Come?
Morning All
Well despite the downgrade of Europe being "factored in", the Australian equity market took quite a sharp hit yesterday. Our futures fell some 30points in the first 5minutes in quite a move, before recovering off the 4110 lows.
To me, I believe there is increasing evidence that a short term high is in. I have shown a number of targets for this rally and the cash market was unable to break above the first 4200 level. Despite, US markets continuing to rally, Australia remains de-coupled and I believe we are now in the beginning stages of a protracted trend lower. I have shown a number of charts and setups of late illustrating this view and pls read the following link for a refresher: http://swingtradersedge.blogspot.com/2012/01/more-evidence-of-bearish-turn-ahead.html.
The XJO chart below shows a completed countertrend rally off the low, completing at Fridays 4200 high. We have a double top/triple top at 4200, a completed 5 wave move off the recent low, and confirmation with yesterdays sell off. My momentum indicators on my short term time frames all made a new momentum low yesterday thus my highest probability trade is to sell the first rally before any meaningful low can form. Obviously my view will be wrong if we recapture the 4200 level.
XJO 15mins:
Today could be quiet given the US holidays. We are indicated at 4135 in the SPI futures which puts us just 5/10 points off yesterdays highs. Straight out of the gates I would be looking to short 4140/4145 in the SPI with stops above 4150. Support comes in at 4120 and 4110 today and I will be looking to cover some shorts into this region today given the possible quiet nature. Note we have RIO and FMG production numbers out today.
P.S. Is the S&P500 tracing out a Head and Shoulders top? Too early to say but my strategy remains selling 1290s with stops above 1305. I like to get short at strategic levels in this market and add on confirmation.
S&P500 Eminis 15mins:
Well despite the downgrade of Europe being "factored in", the Australian equity market took quite a sharp hit yesterday. Our futures fell some 30points in the first 5minutes in quite a move, before recovering off the 4110 lows.
To me, I believe there is increasing evidence that a short term high is in. I have shown a number of targets for this rally and the cash market was unable to break above the first 4200 level. Despite, US markets continuing to rally, Australia remains de-coupled and I believe we are now in the beginning stages of a protracted trend lower. I have shown a number of charts and setups of late illustrating this view and pls read the following link for a refresher: http://swingtradersedge.blogspot.com/2012/01/more-evidence-of-bearish-turn-ahead.html.
The XJO chart below shows a completed countertrend rally off the low, completing at Fridays 4200 high. We have a double top/triple top at 4200, a completed 5 wave move off the recent low, and confirmation with yesterdays sell off. My momentum indicators on my short term time frames all made a new momentum low yesterday thus my highest probability trade is to sell the first rally before any meaningful low can form. Obviously my view will be wrong if we recapture the 4200 level.
XJO 15mins:
Today could be quiet given the US holidays. We are indicated at 4135 in the SPI futures which puts us just 5/10 points off yesterdays highs. Straight out of the gates I would be looking to short 4140/4145 in the SPI with stops above 4150. Support comes in at 4120 and 4110 today and I will be looking to cover some shorts into this region today given the possible quiet nature. Note we have RIO and FMG production numbers out today.
P.S. Is the S&P500 tracing out a Head and Shoulders top? Too early to say but my strategy remains selling 1290s with stops above 1305. I like to get short at strategic levels in this market and add on confirmation.
S&P500 Eminis 15mins:
Monday, 16 January 2012
More Evidence of Bearish Turn Ahead
Morning All,
There are headlines everywhere this weekend in regards to the European downgrades. I have no desire to get into commentary or a protracted debate regarding the ongoing European situation. This is a technical trading blog and it is the use of the technical picture and price action that drives my trading edge. Since the middle of last week I talked about the tiring trend, the waning momentum and the high possibility of a breakdown: http://swingtradersedge.blogspot.com/2012/01/looking-for-bearish-turn.html. Then the "news" comes. These events always confirm to me the value of what I do and what I study. We cannot predict the catalysts or when events will arise, but we can continue to study the underlying conditions and anticipate the markets next likely direction.
Of course, I do read various economic reports and analysis, but they have almost 0 value in my trading. The one commentator who is on the money and has been consistent throughout this whole crisis is John Maudlin. I do thoroughly recommend subscribing to his free newsletter which is always engaging and to the point.
The S&P500 Eminis fell apart on Friday evening breaking through the 1280 level on rumours of a imminent downgrade of European sovereigns. However, the market held in surprisingly well and it looks like all those who shorted the break of 1280 were forced to cover into the close. It is interesting that the first "break" always seems to be a false one, as those who missed out on the uptrend are eager to pile in. Certainly I did not think we would hold in so well especially given the fact the US markets are closed on Monday for Martin Luther King Day. However, I really don't see anything to change my bearish view in the bigger picture. I will continue to short 1290s with stops above 1310. This may be an ABC off the top and thus a new high is coming, but I view any new high as marginal at best.
S&P500 Eminis 15mins:
A series of bullish hammers in the 1275/1280 region resulting in a late day squeeze. I do view this bounce as yet another opportunity to short if you can use stops above 1305. Shorter term traders may want to wait for a retest of 1295 i.e. the previous highs.
Australia will be the first market to react to the official S&P downgrade given the announcement came after hours. I'm sure many commentators will say that the market has "factored this in" as the downgrade was well flagged. Perhaps, but this will do nothing to restore confidence with the ongoing European saga and it sets in motion a whole host of problems in regards to wholesale funding, the bailout package, yields etc etc. The knock on effects are huge.
I have been calling this whole pattern in Australia as part of a Wave 4 triangle with a breakdown to come into 3800 and lower: http://swingtradersedge.blogspot.com/2012_01_12_archive.html. The recent price action continues to confirm this to me as price has struggled to breakout in this 4200 region (cash).
ASX200 Daily:
ASX200 60mins:
Price is testing some very strong resistance here at 4200 and 4220. I believe we are in the final legs of a C wave with a breakdown to come.
My SPI futures range today: 4125 to 4170. Outlier levels 4180 and 4190
My plan today: the good risk/reward trade remains getting short up here with stops above 4200. I really don't know if today is the breakdown day given the way the Eminis and AUD recovered on Friday night. Key supports come in at 4160 and 4150. Any breaks below there should open up a lot of selling.
Thus, I will look to fade any bounce into the 70s with stops above 4180. If we see no bounce from the open, and if there are no buyers at 4155/50, I will look to join the momentum and get short with the appropriate stops looking for 4125 and possibly lower. Potential long scalps at 4150 and 4125 if the order books supports.
SPI March 15mins:
A clear wedge into resistance. 4160 and 4150 are key supports today.
There are headlines everywhere this weekend in regards to the European downgrades. I have no desire to get into commentary or a protracted debate regarding the ongoing European situation. This is a technical trading blog and it is the use of the technical picture and price action that drives my trading edge. Since the middle of last week I talked about the tiring trend, the waning momentum and the high possibility of a breakdown: http://swingtradersedge.blogspot.com/2012/01/looking-for-bearish-turn.html. Then the "news" comes. These events always confirm to me the value of what I do and what I study. We cannot predict the catalysts or when events will arise, but we can continue to study the underlying conditions and anticipate the markets next likely direction.
Of course, I do read various economic reports and analysis, but they have almost 0 value in my trading. The one commentator who is on the money and has been consistent throughout this whole crisis is John Maudlin. I do thoroughly recommend subscribing to his free newsletter which is always engaging and to the point.
The S&P500 Eminis fell apart on Friday evening breaking through the 1280 level on rumours of a imminent downgrade of European sovereigns. However, the market held in surprisingly well and it looks like all those who shorted the break of 1280 were forced to cover into the close. It is interesting that the first "break" always seems to be a false one, as those who missed out on the uptrend are eager to pile in. Certainly I did not think we would hold in so well especially given the fact the US markets are closed on Monday for Martin Luther King Day. However, I really don't see anything to change my bearish view in the bigger picture. I will continue to short 1290s with stops above 1310. This may be an ABC off the top and thus a new high is coming, but I view any new high as marginal at best.
S&P500 Eminis 15mins:
A series of bullish hammers in the 1275/1280 region resulting in a late day squeeze. I do view this bounce as yet another opportunity to short if you can use stops above 1305. Shorter term traders may want to wait for a retest of 1295 i.e. the previous highs.
Australia will be the first market to react to the official S&P downgrade given the announcement came after hours. I'm sure many commentators will say that the market has "factored this in" as the downgrade was well flagged. Perhaps, but this will do nothing to restore confidence with the ongoing European saga and it sets in motion a whole host of problems in regards to wholesale funding, the bailout package, yields etc etc. The knock on effects are huge.
I have been calling this whole pattern in Australia as part of a Wave 4 triangle with a breakdown to come into 3800 and lower: http://swingtradersedge.blogspot.com/2012_01_12_archive.html. The recent price action continues to confirm this to me as price has struggled to breakout in this 4200 region (cash).
ASX200 Daily:
ASX200 60mins:
Price is testing some very strong resistance here at 4200 and 4220. I believe we are in the final legs of a C wave with a breakdown to come.
My SPI futures range today: 4125 to 4170. Outlier levels 4180 and 4190
My plan today: the good risk/reward trade remains getting short up here with stops above 4200. I really don't know if today is the breakdown day given the way the Eminis and AUD recovered on Friday night. Key supports come in at 4160 and 4150. Any breaks below there should open up a lot of selling.
Thus, I will look to fade any bounce into the 70s with stops above 4180. If we see no bounce from the open, and if there are no buyers at 4155/50, I will look to join the momentum and get short with the appropriate stops looking for 4125 and possibly lower. Potential long scalps at 4150 and 4125 if the order books supports.
SPI March 15mins:
A clear wedge into resistance. 4160 and 4150 are key supports today.
Friday, 13 January 2012
Friday 13th
Well I thought that was going to go last night. Markets don't usually top on a Thursday night but when I saw that rally into the high 90s in the Eminis and the sharp reversal, I thought it was game on and I put my head on the pillow. I wrote this on twitter just before lights out:
"$ES_F, $SPY- just got out of long position from low 80s into this strength (93). Looking for a climatic reversal tonight to now SHORT"
My plan was always to put a small short position on in the mids 90s and this was a ideal initial level. It seems clear that the 1280 level is being strongly defended however. Those looking for confirmation should now wait for a clear break of that level to confirm. The way the cash market held in last night, I would not be surprised if we grind higher and bit more into next week. Next week the games may really begin.
Emini 60mins:
Sharp bearish reversal right out of the ideal short zone. However, no follow through just yet and buy the dippers were out in force. Add shorts below 1280.
S&P500 60mins:
The slow grindy wedge higher continues. I have seen these patterns so many times and they usually always end in a sharp sell off at a minimum. Be ready
I really don't have too much to update re Australia today. I wrote a rather long post with a number of charts and this remains my primary view: http://swingtradersedge.blogspot.com/2012/01/looking-for-bearish-turn.html.
My initial range today: 4155 to 4190. Outlier levels 4145/50 and 4220
My day trading plan today (SPI): We are indicated at 4180 this morning which represents a gap up of some 30points. There are a whole host of potential resistance points at 4180, 4190 and 4200. This represents the previous SPI high and double top area, the Sycomm highs, and the 4200 round number respectively.
Given it is Friday, I don't think we will see a strong breakout above the 4200 level and I will short fade early vs cited levels. However, I do feel that this market is consolidating before one final push higher thus I would use any early dip into the low 60s to get out. Any stronger sell off to the 50s is a strong buy. Ultimately, today is trade the range day. I will look to short fade 4200 more aggressively today. Fading is a difficult skillset which needs a lot of practice and good tape reading skills. Of course it is very possible that all those resistance levels get blown out of the water. That is why it is so important to gauge the tone, the order book and ultimately view the Candles before short fading an uptrend. If it doesnt sell off early, stop trying to fade!
SPI March 15mins:
Thanks
Austin
"$ES_F, $SPY- just got out of long position from low 80s into this strength (93). Looking for a climatic reversal tonight to now SHORT"
My plan was always to put a small short position on in the mids 90s and this was a ideal initial level. It seems clear that the 1280 level is being strongly defended however. Those looking for confirmation should now wait for a clear break of that level to confirm. The way the cash market held in last night, I would not be surprised if we grind higher and bit more into next week. Next week the games may really begin.
Emini 60mins:
Sharp bearish reversal right out of the ideal short zone. However, no follow through just yet and buy the dippers were out in force. Add shorts below 1280.
S&P500 60mins:
The slow grindy wedge higher continues. I have seen these patterns so many times and they usually always end in a sharp sell off at a minimum. Be ready
I really don't have too much to update re Australia today. I wrote a rather long post with a number of charts and this remains my primary view: http://swingtradersedge.blogspot.com/2012/01/looking-for-bearish-turn.html.
My initial range today: 4155 to 4190. Outlier levels 4145/50 and 4220
My day trading plan today (SPI): We are indicated at 4180 this morning which represents a gap up of some 30points. There are a whole host of potential resistance points at 4180, 4190 and 4200. This represents the previous SPI high and double top area, the Sycomm highs, and the 4200 round number respectively.
Given it is Friday, I don't think we will see a strong breakout above the 4200 level and I will short fade early vs cited levels. However, I do feel that this market is consolidating before one final push higher thus I would use any early dip into the low 60s to get out. Any stronger sell off to the 50s is a strong buy. Ultimately, today is trade the range day. I will look to short fade 4200 more aggressively today. Fading is a difficult skillset which needs a lot of practice and good tape reading skills. Of course it is very possible that all those resistance levels get blown out of the water. That is why it is so important to gauge the tone, the order book and ultimately view the Candles before short fading an uptrend. If it doesnt sell off early, stop trying to fade!
SPI March 15mins:
Thanks
Austin
Thursday, 12 January 2012
Looking For A Bearish Turn
Morning All,
The Eminis retested the 1280 previous breakout zone and held in. I actually got long in this zone as it was such a great low risk trade. My target for this move is somewhere in the 90s and then I will be in full defensive mode. The more and more I look at the charts, the more bearish I am becoming. I am seeing a tiring trend, weakening breadth and momentum, and a whole stack of resistance up here. I reiterate that I think the next good swing trade will be to the downside.
Emini 60mins:
Breakout and retest of the breakout zone. Held like a dream and bulls can now push up their line in the sand once more. I think this will now be the final push into the highs.
Let me illustrate what I mean by tiring breadth. Despite price making higher highs, underlying breadth readings are not making new highs and diverging with price. For instance, here are the 3 highest readings for NYSE advancing issues over the past month or so:
NYSE Advancing issues
21/12/11: 2681
4/1/12: 2555
11/1/12: 2429
Note how each peak reading is getting lower and lower which is NOT what you want in a healthy uptrend or breakout stage.
Total volume also peaked on the 21st December with 945k. Price is making new highs on dwindling volume. If we look at NYSE UP Volume, this is also painting a diverging picture:
NYSE UP Volume:
17/12/11: 1.14bln
21/12/11: 922k
4/1/12: 678k
6/1/12: 651k
In terms of the actual price charts, I see a number of clear wedges or ending diagonals into resistance.
DOW Jones Industrial Daily:
Clear wedge into potential res. I just cant see a strong breakout in this position.
S&P500 60mins:
Weakening momentum and a clear wedge. Do we need 1 more subdivision to complete a 3rd peak and 3 Indians pattern?
The recent price action in Australia has been bullish no doubt from the low end of the range. However, if this is a genuine turning point in the US, all markets will feel this. I have been monitoring a potential count for a while and now I thought I would show it. Note it is very dangerous forming a count to "fit" in with other markets. However, the more and more I look at the ASX200, AUD and Asian markets, it becomes increasingly clear we are in a triangle of some sort with a potential breakdown looming.
ASX200 Daily:
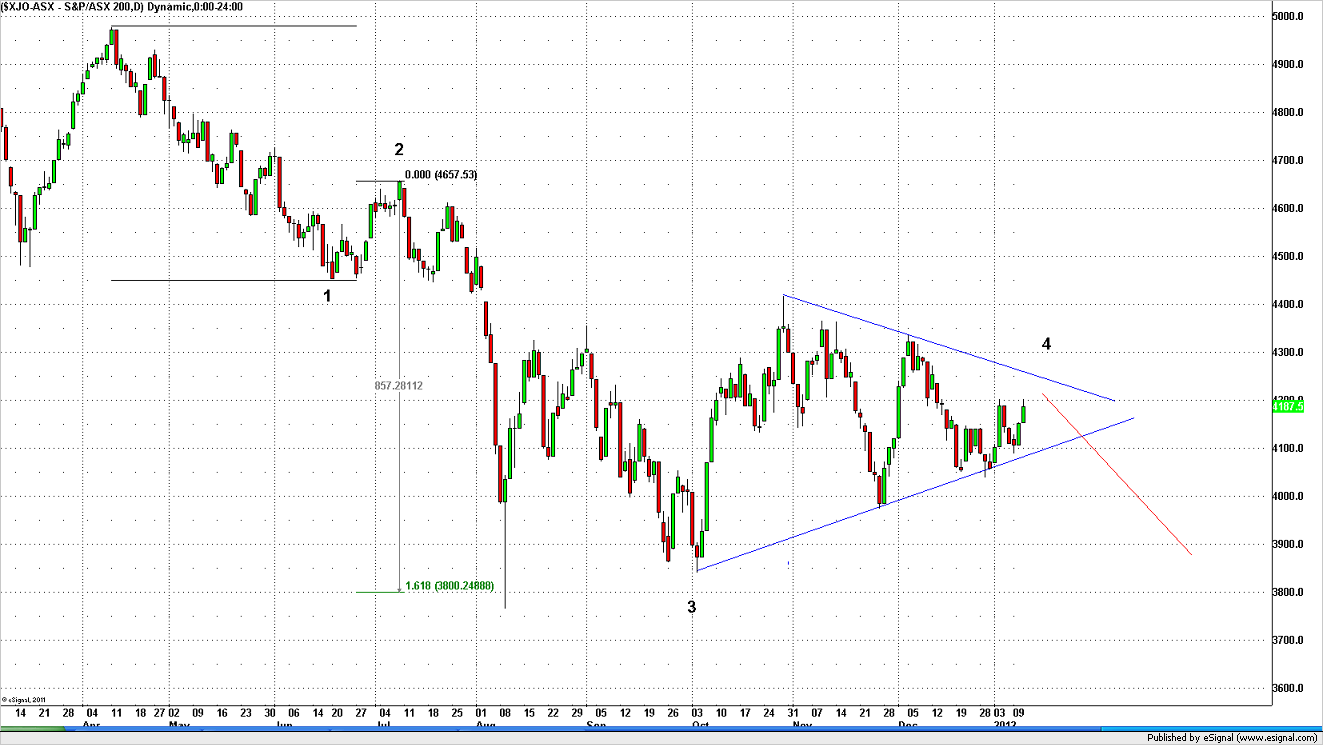
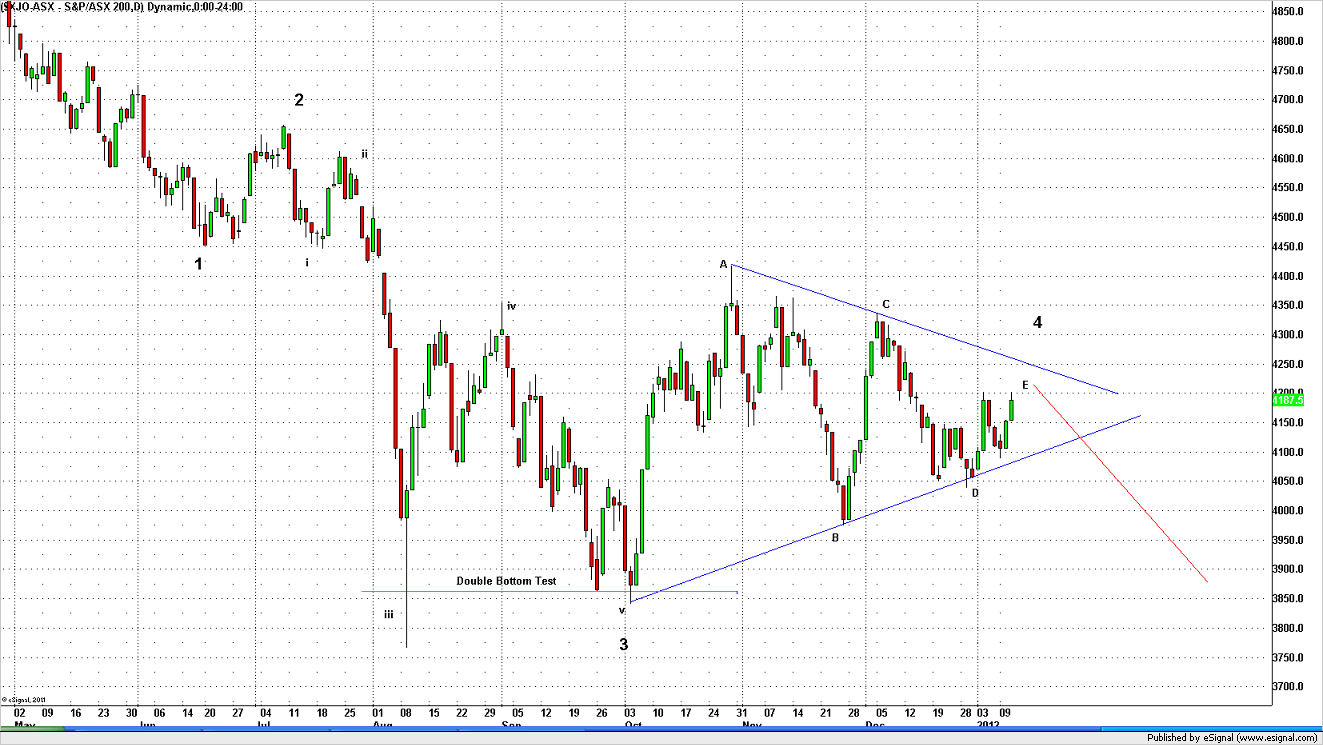
Perfect alternation between 2 and 4. The subdivisions look clear with the biggest strength and force during iii of 3 down. If we saw a bearish candle reversal in coming days, I think an E leg would be complete and a new trend lower underway.
ASX200 Daily ii:
Wave 3 was a perfect 1.618 times the size of wave 1. This chart puts the full move off the top into perspective.
ASX200 60mins:
Are we looking at a potential ABC flat off the low? There are a number of targerts for this move such as 4200 (round number), the 61.8 fib retrace at 4222 and the open gap up at 4240. Of course I have no idea where this will end and that is where your trading skill and reading of the tape comes into play.
SPI Futures 60mins:
Once again, there are a few targets for this move notably 4180, 4200 and 4230. I like the latter level as a great short trade.
In sum, I am growing increasingly bearish. Obviously I do not know when this market turns but there are potential turn dates coming in right now. The key as ever is waiting for confirmation if fading trends. Yesterday I got killed trying to fade the morning drive and I learnt my lessons. Respect the tape, respect the momentum, and wait for the confirm if you are looking for a genuine turning point. The setups are there. Anticipate.
Austin
The Eminis retested the 1280 previous breakout zone and held in. I actually got long in this zone as it was such a great low risk trade. My target for this move is somewhere in the 90s and then I will be in full defensive mode. The more and more I look at the charts, the more bearish I am becoming. I am seeing a tiring trend, weakening breadth and momentum, and a whole stack of resistance up here. I reiterate that I think the next good swing trade will be to the downside.
Emini 60mins:
Breakout and retest of the breakout zone. Held like a dream and bulls can now push up their line in the sand once more. I think this will now be the final push into the highs.
Let me illustrate what I mean by tiring breadth. Despite price making higher highs, underlying breadth readings are not making new highs and diverging with price. For instance, here are the 3 highest readings for NYSE advancing issues over the past month or so:
NYSE Advancing issues
21/12/11: 2681
4/1/12: 2555
11/1/12: 2429
Note how each peak reading is getting lower and lower which is NOT what you want in a healthy uptrend or breakout stage.
Total volume also peaked on the 21st December with 945k. Price is making new highs on dwindling volume. If we look at NYSE UP Volume, this is also painting a diverging picture:
NYSE UP Volume:
17/12/11: 1.14bln
21/12/11: 922k
4/1/12: 678k
6/1/12: 651k
In terms of the actual price charts, I see a number of clear wedges or ending diagonals into resistance.
DOW Jones Industrial Daily:
Clear wedge into potential res. I just cant see a strong breakout in this position.
S&P500 60mins:
Weakening momentum and a clear wedge. Do we need 1 more subdivision to complete a 3rd peak and 3 Indians pattern?
The recent price action in Australia has been bullish no doubt from the low end of the range. However, if this is a genuine turning point in the US, all markets will feel this. I have been monitoring a potential count for a while and now I thought I would show it. Note it is very dangerous forming a count to "fit" in with other markets. However, the more and more I look at the ASX200, AUD and Asian markets, it becomes increasingly clear we are in a triangle of some sort with a potential breakdown looming.
ASX200 Daily:
Perfect alternation between 2 and 4. The subdivisions look clear with the biggest strength and force during iii of 3 down. If we saw a bearish candle reversal in coming days, I think an E leg would be complete and a new trend lower underway.
ASX200 Daily ii:
Wave 3 was a perfect 1.618 times the size of wave 1. This chart puts the full move off the top into perspective.
ASX200 60mins:
Are we looking at a potential ABC flat off the low? There are a number of targerts for this move such as 4200 (round number), the 61.8 fib retrace at 4222 and the open gap up at 4240. Of course I have no idea where this will end and that is where your trading skill and reading of the tape comes into play.
SPI Futures 60mins:
Once again, there are a few targets for this move notably 4180, 4200 and 4230. I like the latter level as a great short trade.
In sum, I am growing increasingly bearish. Obviously I do not know when this market turns but there are potential turn dates coming in right now. The key as ever is waiting for confirmation if fading trends. Yesterday I got killed trying to fade the morning drive and I learnt my lessons. Respect the tape, respect the momentum, and wait for the confirm if you are looking for a genuine turning point. The setups are there. Anticipate.
Austin
Wednesday, 11 January 2012
That Worked, Now What?
Morning All
Well we got the breakout in Australia and subsequently in the Eminis yesterday as forecast here: http://swingtradersedge.blogspot.com/2012/01/turnaround-tuesday.html. The power of Tuesdays I hear you cry. The Eminis broke out and traded just short of my 1293 short zone before selling off and giving back some of its gains. As I write, they are now trading as low as 1284. To me, I think this completes the final legs of this rally and am looking for swing short opportunities. Remember, it is all about low risk/high reward trades and I think fading this market in 1290/1300 with stops above 1310 is the best trade right now. Breadth is waning, volume is not picking up despite the market making new highs, and we now have a clear climatic ending pattern forming in the S&P500 in the form of a 3 Indians (pls see below).
Emini Breakout
The breakout played out perfectly yesterday. Any move now back down below 1280 confirms a failed move higher and a significant high.
S&P500 Daily:
This is the res zone and sell zone. If u are a daily chart trader, wait for that bearish candle confirm out of here. If u are more short term, its time to be switching to fade trades.
S&P500 60mins 3 Indians
A climatic 3 Indians pattern is shaping up. 3 peaks with 3 lower highs on the momentum indicator. Use your appropriate entry signals and anticipate a move lower.
To Australia. My short term low update at ASX200 4100 worked very well: http://swingtradersedge.blogspot.com/2012/01/update.html
Yesterday I wrote in the SPI:
"I still remain in buy mode today given the previous 3 day sell off, the bullish divergences, and the support levels coming into play. Holding above 4100 would indicate a retest of 4115 at a minimum and possibly as high as 4130/4140."
This morning the SPI is indicated at 4148. I think there are 2 possible scenarios here. There is the potential that this is the end of the move higher and we sell off straight away from 4150, resuming the daily downtrend. Or, we continue to grind up to 4180 and retest the previous highs. I am not sure which one will play out obviously but if the Eminis are going to peak here, I cant see Australia rallying much higher.
My range today (SPI): 4120 to 4160. Outlier levels 4180
My plan today: As per above, I will now be switching out of buy mode and potentially looking for a high/bearish reversal. I will short fade 4150/4155 early with stops above 4160. If there is no sell off early, look for this short term trend to potentially grind higher up to 4180 which would present a lower risk short entry.
ASX200 Cash 15mins:
I showed this chart 2 days ago at 4100. We have now seen the breakout and are retesting key Fib res areas.
SPI 60mins continuous:
Yesterdays breakout extended overnight. 4140 is the 61.8 fib retrace and 4150/4155 marks an open gap which could prove some early res. If we don't sell here, we are going to 4180.
Well we got the breakout in Australia and subsequently in the Eminis yesterday as forecast here: http://swingtradersedge.blogspot.com/2012/01/turnaround-tuesday.html. The power of Tuesdays I hear you cry. The Eminis broke out and traded just short of my 1293 short zone before selling off and giving back some of its gains. As I write, they are now trading as low as 1284. To me, I think this completes the final legs of this rally and am looking for swing short opportunities. Remember, it is all about low risk/high reward trades and I think fading this market in 1290/1300 with stops above 1310 is the best trade right now. Breadth is waning, volume is not picking up despite the market making new highs, and we now have a clear climatic ending pattern forming in the S&P500 in the form of a 3 Indians (pls see below).
Emini Breakout
The breakout played out perfectly yesterday. Any move now back down below 1280 confirms a failed move higher and a significant high.
S&P500 Daily:
This is the res zone and sell zone. If u are a daily chart trader, wait for that bearish candle confirm out of here. If u are more short term, its time to be switching to fade trades.
S&P500 60mins 3 Indians
A climatic 3 Indians pattern is shaping up. 3 peaks with 3 lower highs on the momentum indicator. Use your appropriate entry signals and anticipate a move lower.
To Australia. My short term low update at ASX200 4100 worked very well: http://swingtradersedge.blogspot.com/2012/01/update.html
Yesterday I wrote in the SPI:
"I still remain in buy mode today given the previous 3 day sell off, the bullish divergences, and the support levels coming into play. Holding above 4100 would indicate a retest of 4115 at a minimum and possibly as high as 4130/4140."
This morning the SPI is indicated at 4148. I think there are 2 possible scenarios here. There is the potential that this is the end of the move higher and we sell off straight away from 4150, resuming the daily downtrend. Or, we continue to grind up to 4180 and retest the previous highs. I am not sure which one will play out obviously but if the Eminis are going to peak here, I cant see Australia rallying much higher.
My range today (SPI): 4120 to 4160. Outlier levels 4180
My plan today: As per above, I will now be switching out of buy mode and potentially looking for a high/bearish reversal. I will short fade 4150/4155 early with stops above 4160. If there is no sell off early, look for this short term trend to potentially grind higher up to 4180 which would present a lower risk short entry.
ASX200 Cash 15mins:
I showed this chart 2 days ago at 4100. We have now seen the breakout and are retesting key Fib res areas.
SPI 60mins continuous:
Yesterdays breakout extended overnight. 4140 is the 61.8 fib retrace and 4150/4155 marks an open gap which could prove some early res. If we don't sell here, we are going to 4180.
Subscribe to:
Posts (Atom)