

The Eminis retested the 1280 previous breakout zone and held in. I actually got long in this zone as it was such a great low risk trade. My target for this move is somewhere in the 90s and then I will be in full defensive mode. The more and more I look at the charts, the more bearish I am becoming. I am seeing a tiring trend, weakening breadth and momentum, and a whole stack of resistance up here. I reiterate that I think the next good swing trade will be to the downside.
Emini 60mins:
Breakout and retest of the breakout zone. Held like a dream and bulls can now push up their line in the sand once more. I think this will now be the final push into the highs.

Let me illustrate what I mean by tiring breadth. Despite price making higher highs, underlying breadth readings are not making new highs and diverging with price. For instance, here are the 3 highest readings for NYSE advancing issues over the past month or so:
NYSE Advancing issues
21/12/11: 2681
4/1/12: 2555
11/1/12: 2429
Note how each peak reading is getting lower and lower which is NOT what you want in a healthy uptrend or breakout stage.
Total volume also peaked on the 21st December with 945k. Price is making new highs on dwindling volume. If we look at NYSE UP Volume, this is also painting a diverging picture:
NYSE UP Volume:
17/12/11: 1.14bln
21/12/11: 922k
4/1/12: 678k
6/1/12: 651k
In terms of the actual price charts, I see a number of clear wedges or ending diagonals into resistance.
DOW Jones Industrial Daily:
Clear wedge into potential res. I just cant see a strong breakout in this position.

S&P500 60mins:
Weakening momentum and a clear wedge. Do we need 1 more subdivision to complete a 3rd peak and 3 Indians pattern?

The recent price action in Australia has been bullish no doubt from the low end of the range. However, if this is a genuine turning point in the US, all markets will feel this. I have been monitoring a potential count for a while and now I thought I would show it. Note it is very dangerous forming a count to "fit" in with other markets. However, the more and more I look at the ASX200, AUD and Asian markets, it becomes increasingly clear we are in a triangle of some sort with a potential breakdown looming.
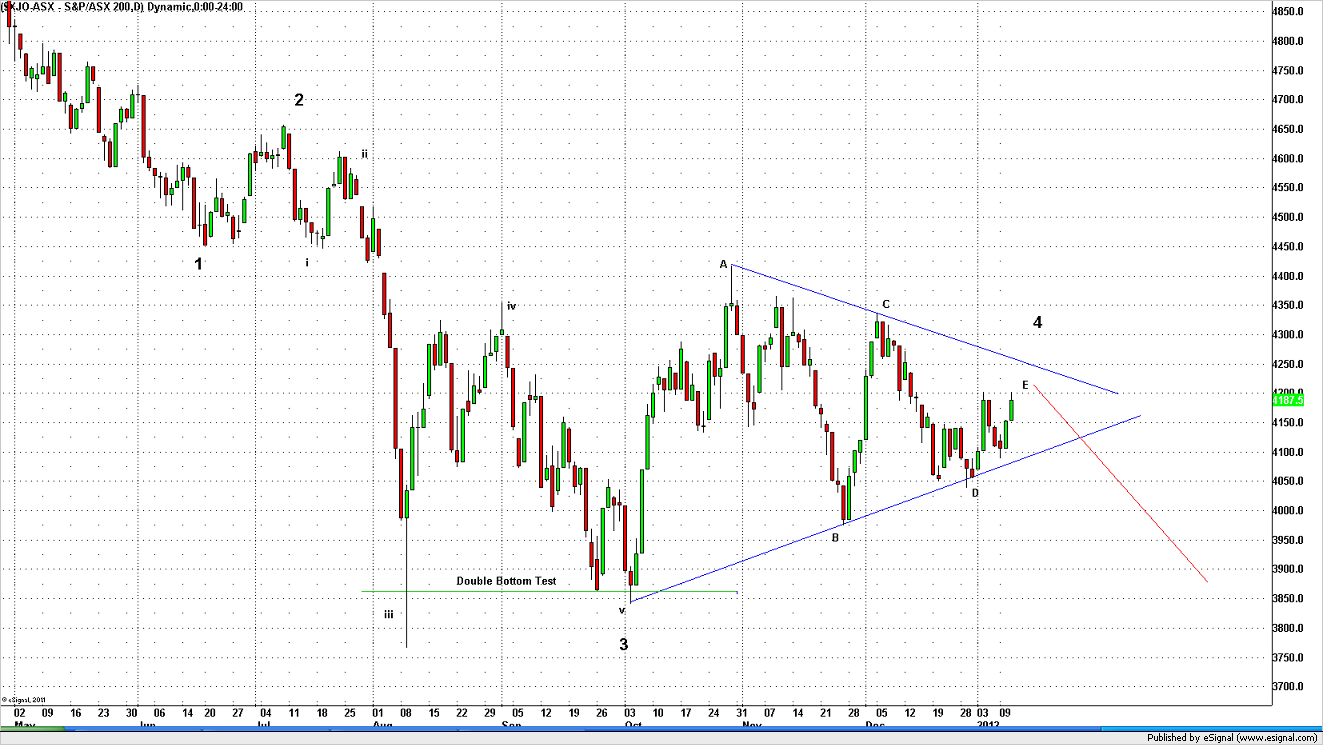
ASX200 Daily:
Perfect alternation between 2 and 4. The subdivisions look clear with the biggest strength and force during iii of 3 down. If we saw a bearish candle reversal in coming days, I think an E leg would be complete and a new trend lower underway.
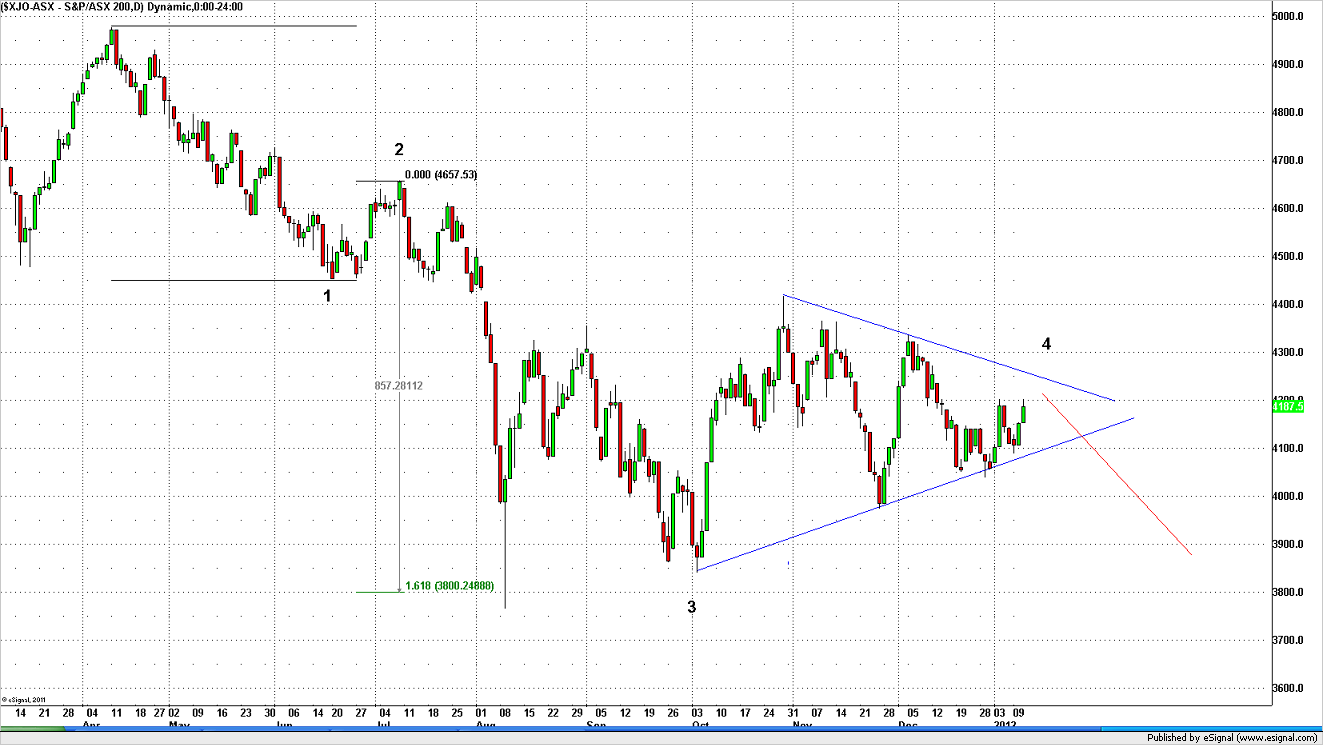
ASX200 Daily ii:
Wave 3 was a perfect 1.618 times the size of wave 1. This chart puts the full move off the top into perspective.
ASX200 60mins:
Are we looking at a potential ABC flat off the low? There are a number of targerts for this move such as 4200 (round number), the 61.8 fib retrace at 4222 and the open gap up at 4240. Of course I have no idea where this will end and that is where your trading skill and reading of the tape comes into play.

SPI Futures 60mins:
Once again, there are a few targets for this move notably 4180, 4200 and 4230. I like the latter level as a great short trade.

In sum, I am growing increasingly bearish. Obviously I do not know when this market turns but there are potential turn dates coming in right now. The key as ever is waiting for confirmation if fading trends. Yesterday I got killed trying to fade the morning drive and I learnt my lessons. Respect the tape, respect the momentum, and wait for the confirm if you are looking for a genuine turning point. The setups are there. Anticipate.
Austin