Tuesday, 13 September 2011

Intermediate Low Is In

Good Afternoon All

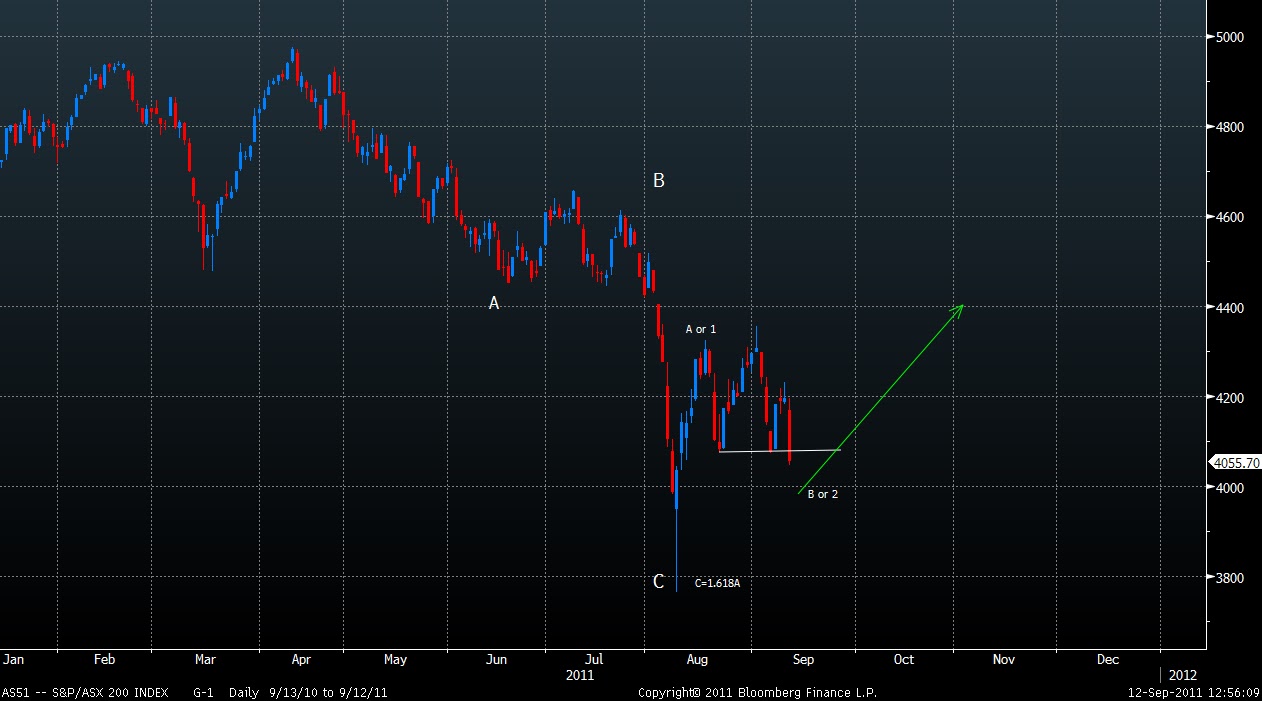
(UPDATE) Asia is selling off and this is now completing all the Asian setups I showed here: http://swingtradersedge.blogspot.com/2011/09/getting-ready-for-swing-low.html. Everything is now coming together, just need that squueze event.

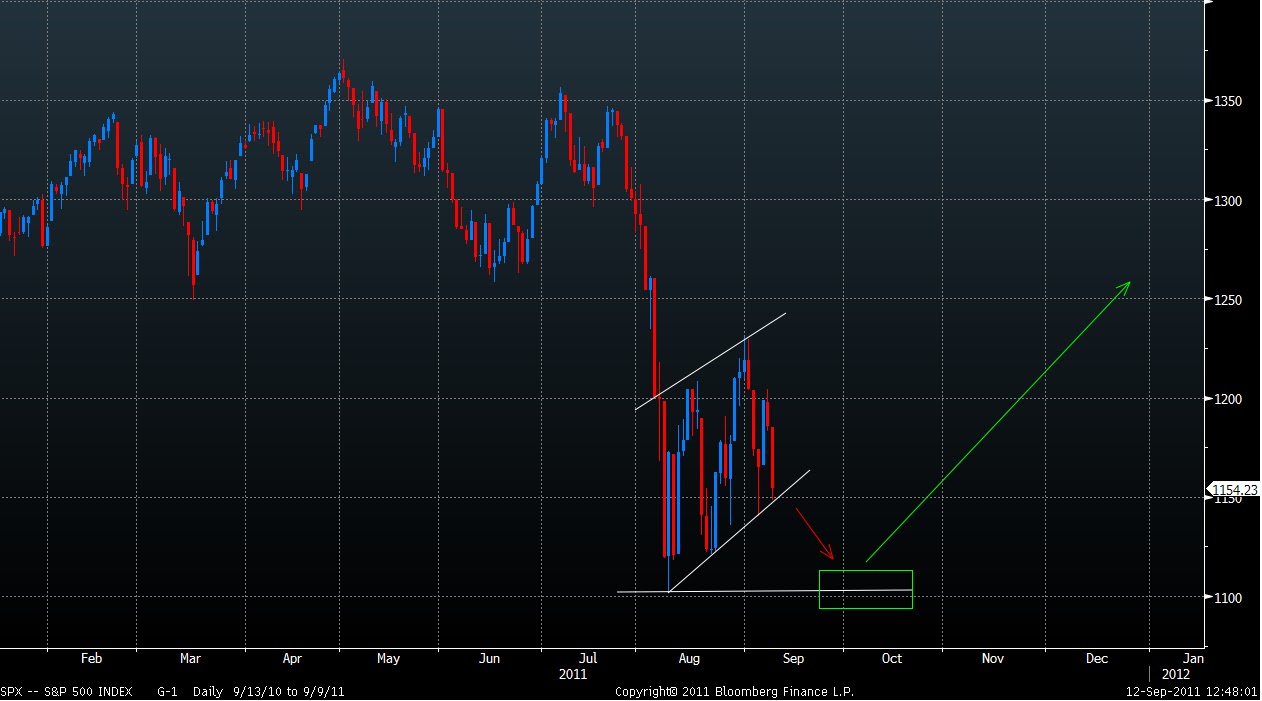
I thought I would put myself on the line today and call an intermediate low in place for US markets. Yesterday I put out a post looking for the bigger picture swing low and I think there is enough evidence out there to now confirm this. We did not get a clean double bottom pattern and certainly the rally off the low doesn't look impulsive. However, the S&P 500 has successfully defended the 1130/1140 zone on several occasions and held every time. The DAX has hit my 61.8 fib retrace and put in a small reversal candle. The Australian futures hit the key 4000 level and have rallied 80pts. The EUR hit my 1.35 level and rallied some 150pips. And most importantly, every single technician I read is bearish and I know that these are the kind of moments when one has to stand out.

The market continues to hold the 1130/1140 area despite the panic and fear in European markets. When a market continues to hold like this, it is sending a loud signal of underlying strength. One more strong session will lead to a breakout.

S&P500 15mins:
S&P 500 Daily Current:
A number of hammers have now formed at the low end of the range. This is the Daily confirmation I was waiting for.

No doubt the S&P500 looks like a 3 wave move off the low. However, there have been many occasions in the past where the S&P has staged a strong breakout despite this. Look at the examples below. Every Elliottician will be labelling the current setup as a iii of (iii) of 5. I am yet to see anyone successfully predict/anticipate a iii of (iii) and they are in fact one of the most fadeable patterns out there. Dont be that bear looking for the end of the world- they are black swans.

S&P500 2010
Note the initial rally off the July low was a clear 3 wave push. The market tried to retest but put in a higher low. This led to a significant breakout and rally. Interestingly, this breakout occurred as the market began to price in QE2. Same again with QE3 around the corner?

S&P500 2006:
A similar 3 wave push and retest was the initial pattern before this strong breakout
S&P500 2005:
In 2005 the S&P formed a very similar pennant/flag type pattern to the current setup. There was a higher low that formed that led to a significant breakout.
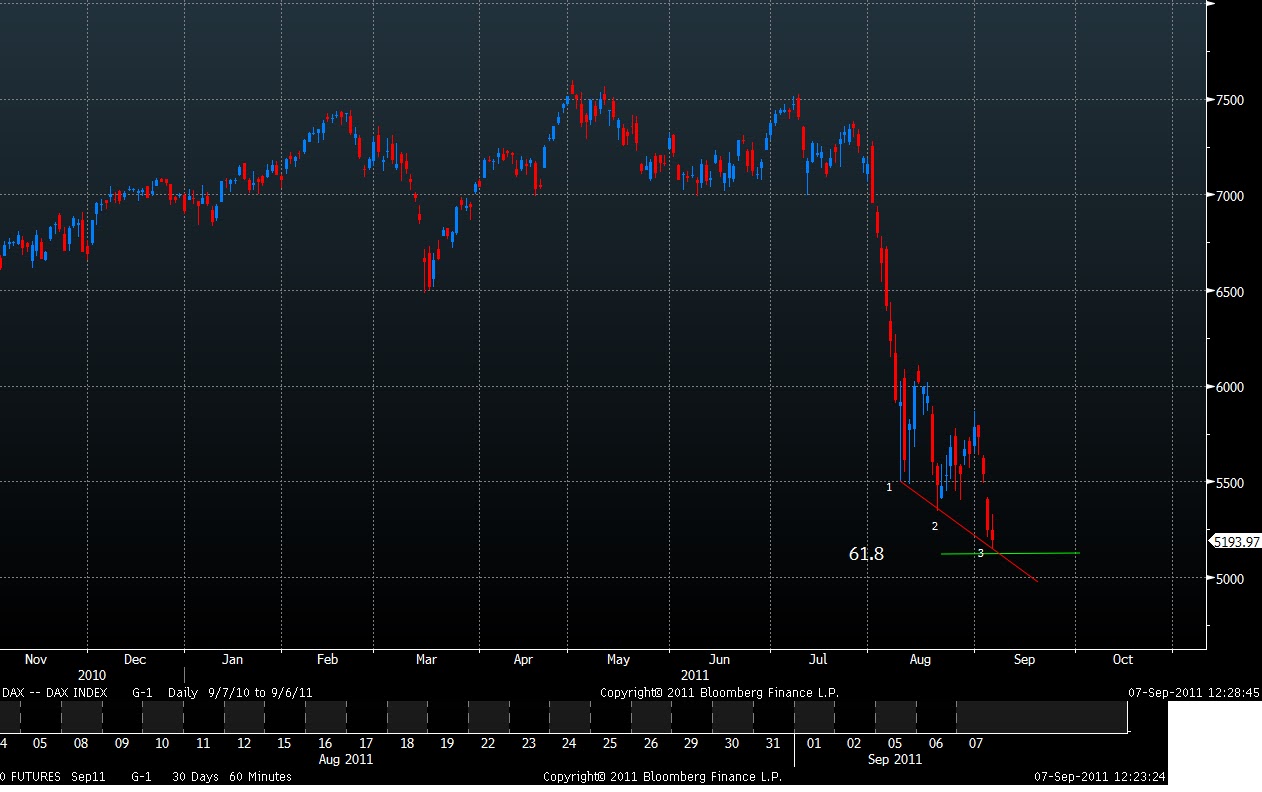
And finally to the heart of the crisis- the DAX. This is now forming a classic ending wedge pattern right at the 61.8 fib retrace level off the 2009 lows. I dont know what will trigger the breakout, but I do knnow there are a lot of shorts out there and Central banks doing everything they can to fix things.

DAX Daily:

In sum, I think the markets are on the cusp of a major breakout. Obviously there is some work to do before this can be fully confirmed but I am happy to get some risk on board first and then see how it plays out.

Thanks
Austin

Monday, 12 September 2011

Getting Ready For The Swing Low

Good Afternoon All,

This market continues to follow the technicals with precision. This blog has successfully identified a number of turning points in the market over the last few months and Friday nights sell off was no exception. I believe this is the final leg lower into a bigger picture intermediate low. I do not know if the market will bottom today, Tuesday or next week, but certainly I am getting ready for a strong turning point. You have to be prepared and you have to anticipate to successfully make money in the market. Certainly everything looks and feels very scary right now, and that is exactly how it should feel at such a juncture. Remember, you have to be willing to buy it when no one wants it just as you have to be willing to sell it when everyone wants it.

S&P 500 Daily:
The market sold off right at the top end of the range identified. I am now looking for a test and double bottom trade in the low 1100s. Markets very rarely begin a new trend without a "test" of the previous low. The wise trade is to wait for confirmation such as a bullish candle out of this zone before taking the bigger picture long swing.

(Update) I am increasingly thinking that we may not even get the luxury of a clean retest of 1100. Given where the DAX is trading, I believe we may even see a higher low form tonight at 1120/1130. Once again, wait for confirmation.

S&P 500 07 parallel
This is the updated 07 S&P500 parallel. The S&P500 in 2007 is shown by the white line. In 07 we saw a panic retest of the lows that led to an intermeadiate bottom and I think this is where we are at right now.

ASX200 Daily:
I believe this market put in a climatic bottom in early August. Australia has been one of the strongest markets globally of late. This current sell off should form a higher low in the coming days leading to another strong move higher.

ASX200 60mins:
3950 to 4000 is my key support zone. This marks the round no support, the 61.8 retrace, and also an area where A=C off the high.

Hang Seng Daily:
Hong Kong is setting up a nice double bottom trade right at the support shelf. There is also a possible complete 5 wave move down coming into play here.

Japan Daily:
Another double bottom trade lining up here. Interestingly, some months ago I wrote an article about this market following a parallel with the S&P500 post the flash crash and forecast that this market would retest its lows: http://swingtradersedge.blogspot.com/2011/03/nikkei-vs-s-flash-crash.html. This has now played out. Note the 1-2-3 pattern into the current low which is a bullish ending pattern.


Shanghai Composite Daily:
We have seen a breakdown out of the consolidation pattern I showed a few days ago. Now looking for a test of the support shelf as the final move lower.

In sum, there are a number of markets now coming into their respective support zones. This couples with the DAX coming into its 61.8 Daily retrace at the 5100 level. The key for many of these setups will be waiting for a Daily closing confirmation candle as we are still a bit early. Tuesdays are my turning day and I think we will see a bit more panic before these setups play out. I cant rule out a low tonight however. Also note that it is a full moon this Tuesday which often produce turning points :)

Obviously there is a lot of fear out there with concerns that a European nation may go under and CDS prices across the region are blowing out. Thus caution is warranted for those who do not know what they are doing. However, I do know that the best money is to be made at market turns so be prepared via these charts.

Thanks
Austin

p.s. Ollie was asking about the USD. I think the EUR is coming into an interesting short term support area also at 1.3450/1.35. I am not calling a low here but this if this market is going to hold in, it is here.

EURUSD Daily:
A=C off the low and a key pivot point comes in here

Thursday, 8 September 2011

The Last Sell Zone

Good Afternoon

Yesterday I said that I thought there would be one more rally before a final push to new lows. We got the rally indeed but certainly the move seems a lot stronger than I had anticipated. Volume was low and my options desk informs me that much of the move into the close was exaggerated due to large short gamma positions coming into expiry. More importantly, if this market is going to sell once more, it has to happen now. Otherwise, I feel a longer term low is in. I am seeing an interesting reversal in Asian markets today out of clear resistance levels. Asia has often led the markets globally so lets see if it proves to be a lead indicator once again.

The main point I stressed yesterday was that this is not the time for longer term swing short positions. There is no need to finesse the market here for longer term traders. This point remains.

SPI Day Session 15mins:
Despite a strong 2% overnight lead, our market opened up 1% and then sold off immediately. This was right out of the 61.8 fib level and the open gap. Once again, the power of these fib levels was shown today. This will probably leave a bearish reversal candle today on the daily.


AUDUSD 15mins:
Rally right into the previous breakdown level and the 61.8. The reversal was enhanced by a weak jobs number.

Copper 15mins:
Same thing. Price has rallied right into the 61.8 and sold off. ABC off the low?

S&P500 15mins:
Coming into tonight, the cash market is right into the 61.8 and the previous breakdown level. Will this market play out like what we are seeing in Asia? Short first and ask questions later.

In sum, we are at a critical juncture for the bears. The market needs to sell here otherwise I believe the intermediate low is in. I am short the Eminis at 1196.50, with stops above 1205. I see this as a low risk trade and will add if I see more confirmation.

Austin

Wednesday, 7 September 2011

Where To Now?

There has been quite a sell off since my last post: http://swingtradersedge.blogspot.com/2011/09/bearish-turn-confirmed.html. The patterns and scenarios that I talked about have played out to a tee. The market is now at a very interesting juncture indeed. I believe we will see a short term rally and one final retest of the lows. This retest should present a great buying opportunity for a potential intermediate rally. No doubt there are a lot of negative headlines and bearish catalysts out there. However, as per my previous bigger picture posts, the time to put on the big short swing trades are not at this current market juncture. I would not be surprised if the market caught a genuine bid from the technical levels I am about to cite in anticipation of QE3/Operation twist. The FED will do everything in its powers to stem this economic decline. As i keep saying, governments changes the rules and do everything they can after the initial panic.

My 2007 parallel scenario continues to provide a very accurate road map.

S&P Daily 2007- the move from the high
As you can see, the market had one more retest of the lows before a genuine bottom could be formed and a 2/3 month counter trend rally ensued. I have marked on this chart where I think we are at.


S&P 500 Daily Current
We have seen a clear topping pattern for a Wave 4 top. Any bounce up to 1170/1180 over the ensuing days is a great shorting opportunity for a move back down to the lows. Markets often need to "test" their lows before a new trend can begin.


The underlying breadth certainly seems to support this outlook. Volume has been less on this decline since the Wave 4 top and the highest number of declining issues etc was during the Wave 3 down.

In Asia, the SPI futures were 10pts short of my first target at 4055. The ending diagonal and failed breakout was a great bearish pattern. I think there may be one more move down to come into the green boxes cited (the 61.8). I do not think we will trade as far down as the lows. Be ready to buy the stocks you like for the big long swing.

SPI Futures Day Session 60mins:


The heart of the current crisis lies in Europe. The DAX is no doubt the bell weather of the region and this market is now approaching a key support level. Just as the SPX bottomed at the 38.2 retrace and the ASX200 at the 61.8, the DAX is now approaching the 61.8 right when fear and panic are at a fever pitch. This is one of those moments when you have to be prepared to get long and do the uncomfortable thing.

DAX Weekly:
The 61.8 retrace and key pivot line.

DAX Daily:
The 61.8 comes in at 5120. There is also a clear 3 wave push pattern into this level- an ending pattern.

In sum, the markets seemed to catch a bid last night after the US hols. I think this bounce will present one last good shorting opportunity for the nimble. Look for the bigger picture long swing trades at the DAX 5100/5125 level, ASX 4050/4000, S&P500 1102/1090. These should be formidable supports in coming days.

Thanks
Austin

Friday, 2 September 2011

Bearish Turn Confirmed

Morning All

Yesterday we saw a strong reversal in the Australian market that saw us give up a 1.4% early gain to close flat. The market traded right into the open gap on the Daily and failed, forming a good bearish reversal candle. Once again I find it very interesting that Australia continues to be a lead indicator for global equities. Europe and the S&P500 went on to register losses despite a strong ISM print. US markets opened on their highs and closed on their lows. Breadth was bearish with 1616 decliners to 222 advancers and a strong bearish reversal candle was left out of resistance. What more do u need? Obviously tonight's non-farms number will be the focus tonight but the price action is telling me we have lower to go.

SPI futures Daily (Australia day session only):
Price reversed right out of the open gap area yesterday and left a bearish reversal candle. Short term traders should now be using yesterdays highs as a stop to get short.


SPI futures 60mins:
We failed yesterday right at the double top area in what looks to be a classic failed breakout. Note the 3 push ending wedge pattern. This will be triggered today and I am looking for a target right back down to 4050/4100.


Shanghai Composite
I have been watching the setup for a while. China has failed to rally despite strong overnight leads for the past 2 weeks. This market has formed a clear triangle pattern and this should be triggered today on the open. Look for weakness down to the previous lows.


AUDUSD Daily:
The AUD rally off the low also looks to be nearly done to me. This looks like a clear ABC move off the low and price is now forming a Ending wedge pattern right at previous resistance/breakdown level.

AUDUSD Daily:
This is the Daily count and pattern. Price has moved right into the previous breakdown candle and this should be formidable resistance.

In sum, it appears clear to me that we are on the cusp of a big pullback. Whether this leads to a retest of the lows I do not know yet. However, as a short term trader I short first and ask questions later. Remember that the first day of the month is often a very good precursor for the rest of the months trading. Day 1 was a strong rejection out of good resistance. We could be set for some serious weakness once more.

Thanks
Austin

p.s. Shout out to Ollie on yesterdays comments. Some really good charts and analysis there so pls read. Keep them coming

Thursday, 1 September 2011

Turning Bearish

Morning All,

The end of month ramp job has done what it was supposed to do and we have seen a strong run up across markets into this date. I now think there are some interesting shorting opportunities with a great risk/reward. In my last post I commented that the market was feeling tired. I now feel that enough evidence is there to suggest good shorting opportunities.

First things first, we have a classic A=C move off the low in the SPX at 1229. The market gapped up on the open, made its high in the first hour and then grinded lower throughout the day. I think this is now a great low risk short entry for shorter term traders with stops above 1229. The first day of the month has a habit of setting the tone for the rest of the month. For instance, the S&P high was on the 2nd May (the first trading day of the month) leading to a 70 point fall; August 1st marked the raising of the debt ceiling which saw a sharp reversal lower leading to a further 150 point fall. These relationships have been going on for the past 2 years and it is not just a coincidence.

S&P 60mins:
Clear A=C off the low and reversal right at the top end of the trend channel. I am short now and a move below 1200 would confirm the setup.


S&P 15mins:
The recent action looks like a clear ending wedge to me right at the top end of the range

I continue to highlight the S&P 500 parallel with the initial move out of the 2007 market high. Once again, I find the current juncture and wave structure very interesting here. In 2007, we saw one final move lower to complete a Wave 5/double bottom before the intermediate rally began. I think we could also be looking at a possible turning point here for one more retest of the low before a stronger rally can begin. If the market doesn't sell here, than this parallel is gone.

S&P 2007 Move from the high


S&P 500 2011 current move from high


Bottom line, the US markets are at a interesting juncture. I think a tradeable high may be in. Breadth has certainly deteriorated and there is a lack of volume showing no interest to buy stock at these levels. I also find it interesting that lead risk assets such as the AUD did not rally last night despite the equity mark up.

Tuesday, 30 August 2011

Feeling Tired

No charts here tonight but just a quick ramble. The Australian market is beginning to feel tired. I know I stressed in my previous posts that now is not the time to be too bearish. For one thing we have rallied quite considerably since those posts. More importantly however, the price action today and during the last few sessions is indicative of a market in a distribution process. Asia has had a number of positive overnight leads from US markets but there has been a genuine lack of follow through. Today we gapped up on the open to test the previous interim highs at 4300 on the SPI futures and topped in the first minute of trade. The market sold off all day closing on its lows. It looked like a clasic bull trap. One bad session overnight and I fear we could be looking at a quick 4-5% decline.

From where I sit, there are not many accounts doing anything. Most do not want to chase this market up here. Volume has completely dried up with only $4.4bln through on Monday despite a 1.5% rally. The Banks have failed to catch a bid for over a week now. RIO does not want to breakout to upside. Energy names like WPL are just not heeding the rally in crude, a bearish divergence. The strongest sectors for the last 2 sessions have all been the defensive sectors namely property, healthcare and utilities. Bottom line, the initial euphoria that saw us rally very strongly off the climatic low seems to have firmly dissipated.

Australia was the first global equity market to bottom in early August. We led the global rally. Again on the 17th August we led global markets as the ASX200 was the first market to put in a interim high before a big sell off ensued which saw the S&P 500 retest its lows. Everything was set for a strong gain today but the market swiftly reversed closing on its lows.  Are we witnessing a lead indication from Australia once more in equities? Dont rule it out.

I am not saying that we are on the cusp of a major sell off. I am however very cautious in the short term. Both the Eurostoxx and the DAX have failed to rally meaningfully which makes me think they are both consolidating before a final thrust lower. Interestingly, despite the rally in US indicies, the credit markets continue to worsen and the TED spread continues to widen. One of them will give and the credit markets have a habit of being way smarter than equity folk.

Good luck. I am looking at good resistance in the Eminis at 1200/1210 tonight. Any more above 1215 and I am probably wrong in cautiousness.

Thanks
Austin


Thursday, 25 August 2011

My Experiences in 2007

They say that experience counts for everything. I couldn't agree more and I believe this is particularly apt in the world of trading. In this post I wanted to reflect on some of my experiences as a relatively young trader at a major investment bank as the market topped out in 2007 and 2008. In that small timeframe, I was privy to the unfolding of a number of historic events that would shock and change the financial marketplace. I witnessed the full cycle from bull to bear and the complete range of emotions from euphoria to outright fear. More importantly, I saw how the market developed and unfolded from a technical perspective. As each day passes currently, I feel I am reliving many of these moments and experiences.I wrote about some of this in a post back in June and this has played out with eerie precision thus: http://swingtradersedge.blogspot.com/2011/06/party-like-its-2007.html AND http://swingtradersedge.blogspot.com/2011/06/topping-pattern-anyone.html.

I didn't have the experience back then in 07 to effectively trade that environment to my full potential and this has certainly shaped who I am and how I trade today. I hope these words can in some way can give you a vital bit of information to prepare you for the times ahead.

Markets always seemingly look their best at their highs for the unsuspecting.One by one, topping patterns slowly creep up on you. The S&P 500 made its high in 2007 not so much with a bang but on a whimper. The initial move out of the high grinded lower. It was only slowly that the mainstream heard of credit stress and the subprime debacle, the strains in the interbank lending market, hedge funds going underwater and mass redemptions hitting the market. It was only after all this occurred that the economic data began to soften. 2 months out of the high and we were in a full blown sell off. The central point to make is that this fear and panic reached a crescendo very quickly out of the high in 2007 just as it is now. By the time the market had become fully aware of the problems, the move lower was done. Just when it really felt like the world was ending, the S&500 bottomed on the 38.2 retrace in Jan 2008. This was 4 months out of the high. A long slow painful grind ensued for the next 3 to 4 months. I remember this grind higher very clearly- everytime I tried to short, the market just keep going higher. This is what intermediate rallies do. They frustrate and they do their best to remove the last remnants of the bears. The best times to be short are never in the panic stages but a few months after the panic low.

Fast forward to today and we are seeing the same kind of headlines and the same technical backdrop.The initial move out of the S&P500 high grinded lower. Just as we saw signs of credit stress in 07, we are now seeing severe debt stress for sovereigns and CDS are blowing out to all time highs. Mutual fund outflows have been hitting the market and hedge funds are getting decimated or closing up shop (most notably George Soros returning money). The economic data is also clearly softening now. And once again, fear and panic has reached a crescendo very quickly. Anyone and everyone is now talking about the end of Europe, the debt problems in the US, an imminent market crash, the death of the consumer etc etc. But markets just do not work like this. The best time to be short is never 2 to 3 months out of the initial high. In 07 we made an important intermediate low at the 38.2 retrace after a 4 month sell off. Currently, we bottomed at 1102 right on the 38.2 fib retrace after a 4 month sell off from the high. Coincidence?

Don't get me wrong- there are a lot of topping patterns across markets in the bigger picture. However, these have played out on a short term basis. Don't be that jittery trader who thinks the world is coming to an end. Making money on the short side is actually very difficult to do and you have to be very nimble and opportunistic- not when the crowd is all leaning the same way.

Australia has seen its panic low. Just as I saw genuine fear in 07 and capitulation, I have seen the fear and capitulation now. I talked about this on this blog as it was playing out. I believe this bounce is all part of an intermediate rally that will last at least 2 to 3 months at a minimum. Technically and fundamentally, everything has lined up for that low. I think this rally will be across Asia and the US. This will be choppy and volatile no doubt so there should be ample time to get involved. The double bottom patterns I showed on my last post have worked a treat as an initial entry point.

Now if my experiences and lessons drawn from 2007 are correct, this rally will lead to a momentumental shorting opportunity. But that time is not now.

S&P 500 2007 vs Now
The moves thus far into and out of the high have been uncanny. This simple chart has guided me through the high and recent low. If my take on the parallel is correct, we have seen a climatic low as shown by the red arrow. I believe we are on the cusp of an intermeadiate rally that will last for 1 to 2 months as shown by the green arrow.


This chart was brought to me and updated by my good friend and pro trader, Rich Sexton at: http://marketletters.blogspot.com/. If you trade the FX markets, you must read his blog- daily.


Thanks
Austin


Friday, 19 August 2011

A Fade Indeed

Happy Friday

We got the sell off last night out of the top end of the range as I had hoped. Interestingly once again, Australia was a lead market for our worldwide peers as we put in our high (at the 4300 level :)) prior to the global sell off. This market remains technically driven. Just as the S&P bottomed at the Fibonacci 38.2 retrace off the 2009 low, the recent short term high at 1208 the other night was right on the 38.2 Fibonacci retrace off the May 2011 high. These numbers do not lie. Once again, it all boils down to identifying the low risk trade. I talked about fading at the top end of the range in my last post because there was such a strong area of resistance and a great low risk short entry. This trade has now played out: http://swingtradersedge.blogspot.com/2011/08/is-this-fade.html

Just a quick note on last nights sell off. The S&P 500 cash market gapped down on the open and then went sideways for the remainder of the session. This is not wholeheartdely bearish to me vs what we have seen of late where the market opens on its highs and trends lower closing on its lows. Today is option expiry and I am told that there was a huge open interest in the 1150 strike (5x the normal open interest). It is little surprise to me that we got to this level so quickly. Breath was not as intense as what we have seen in the past with volume of 1.5bln on the NYSE vs the 2bln we saw as we approached the lows. Thus all in all, I do not think this is the end of the world move. I think that we are looking at a normal retracement/retest of the prior rally. This will provide another great buying opportunity in time but we are not there yet. My levels in the Eminis for a potential turn are 1125 and 1100.

So to Australia. Sure enough, a number of the underlying stocks failed at the open gaps/previous breakdown levels i.e. BHP at 40, CBA at 49, WES at 30 etc. This coincided with a perfect bearish reversal out of the 4300 level in the SPI futures. All written here in this blog. So where to from here? I believe that we have a climatic low in place. Thus, our highest probability trade is to buy the retracement out of this recent high. This is easier said than done but I am looking at 4100/4080 and then 4000. I do not know which of these levels will prove to be the low just yet but I imagine we will need more time to form a tradeable low than just a 3 day pullback.

SPI day session 60mins:
This is the chart I showed the other day. A great reversal out of the 4300 level and ending wedge pattern. Note the 3 peak patterns that was the precursor to this topping pattern. Learn these setups.

SPI 60mins:
These are now the targets for the pullback. I think we will need more time before a solid low can form but bear these levels in mind for now.


Looking across Asia, there are a number of great double bottom trades forming. Get ready to buy a confirmed rally out of the previous lows. This would coincide nicely with an Eminis double bottom and a fib retrace in Australia.

Nikkei 15mins:
The central bank is allowed to buy index ETFs as part of their mandate to support the market. This is a great double bottom trade. Do not fade this intervention at such a good buying level.


HSI 15mins:
Another good double bottom trade lining up here soon:

India Daily:
Looking at a great A=C trade here into support. Look for a bullih Daily reversal candleto confirm


Today I am looking at 4080 and 4100 as supports in early trade for the SPI futures. I dont think we see a strong rally out of these levels given it is a friday and given the overnight sentiment. However, as ever, buy support first and sell it if it drops.

Thanks
Austin


Tuesday, 16 August 2011

Is This A Fade?

Morning All,

The SPI futures are indicated at 4295 on the open this morning given last nights positive session in the US. We have obviously seen a V shaped bounce off the recent low and yesterday we saw major outperformance in the cyclical and material sectors which is indicative of increased confidence and the hunt for beta. However, V shape bottoms are very rare. It is tough to fade a strongly trending market but a number of underlying stocks are now testing their previous breakdown levels/open gaps. For instance:

-BHP at 40
-RIO at 76/76.50
-CBA at 49.50
-WBC at 21/21.50
-WPL at 40
-STO at 12.25
-WES at 30

These are significant barriers. There is no hint of a blowout top or bearish reversal yet but I would be very surprised if this market keeps surging from here. Australia was the first market to bottom and will it now be the first market to put in a short term high?

The key futures levels I am looking at is 4300 and then 4320. I will be looking for some kind of bearish confirmation/reversal candle first before getting short. No doubt I am fading the short term trend here, but just as we had to be willing to buy it when no one wanted it, we have to now be willing to sell it when everyone wants it. This is a short term trade only!

SPI Day Session 15mins:
This is the overhead resistance zone and we are now clearly testing the top end of the range. A good risk/reward area for shorts.Note we have seen 3 clear peaks/surges into this level- a favourite reversal pattern of mine.


I am seeing similar patterns in a number of overseas futures markets as well i.e. testing the top end of range. I think the trade is to fade first and then join the breakout if there is no confirmation.

Emini S&P500 15mins:
S&P500 into solid res at 1200/1205. Possible wedge? Sell first, buy if there is no follow through

Eurostoxx 15mins:
Same kind of pattern. A base is forming here under 2350 but we sell resistance first and then buy the breakout if there is no follow through

In sum, if the market is going to fade in Australia, it is here today. A number of the underlying stocks have now met or exceeded their targets. Tuesdays are my reversal day and we are coming into some significant levels. It remains to be seen if the market does actually fade.

Austin


Monday, 15 August 2011

Reflections On The Week That Was

Morning All,

I know I am a cynic. I read the weekend papers and I cant help but cringe. The sensationalism, the drama, the retrospective reasoning. Anyone reading the financial press last week and this weekend would have thought the financial world had just ended. To be sure, the headlines have certainly changed and it may feel like we are on the edge of a precipice, but really the market continues to repeat identifiable patterns and characterisitcs. We talked about the topping patterns across assets here on this blog long before the market broke. We had the capitulation low right at 1102 fib support. There was a perfect retest of this area at the end of the week for a great double bottom trade. Despite the news, despite the volatility, nothing we are witnessing has not already happened before in the market, and the technicals continue to be the guide. It all comes down to experience, identifying low risk opportunities, and being able to put emotions to one side.

We begin the week in Asia with a nice gap in Australia and across most of the region. However, the All Ords is well advanced in its rally vs the rest of Asia and is now testing decent overhead resistance. See the chart below. We did not get the depth of the pullback that I was hoping for last week which makes me think that we may see some short term weakness out of these current levels. V shape lows are very rare (and very difficult to join). There are a number of stocks that are testing overhead gaps and the previous breakdown level- thus this is an area to be cautious and looking for potential resistance/fade trades.

ASX200
4240/4250 is the 38.2 retrace off the high and a previous important high prior to the breakdown. I do think this thrust can go as high as my zone "2" in time but this first area should be significant. I would be waiting for confirm before shorting here though as V shape lows can keep going and going. I do not think we trade as low as tuesdays lows so be very nimble with any shorts.

SPI Futures Day Sessions 60mins:
Open gap and possible wedge type pattern. Note there is a good looking breakout trade in the eminis tonight above 1185 which could invalidate this.


A number of people have asked me what my long term thoughts are given the recent action. To be honest, I really do not know and I don't want to try and predict. This is why I choose to be a trader and not an investor. So many traders fall apart when they try and project beyond a reasonable timeframe. This market continues to look like my 07 parallel and if this is indeed the case, then we are no doubt set for some very tough times indeed. Who knows if another round of QE3 takes place though that completely changes the game. Whos to say that the short ban does not extend beyond Europe thus altering the dynamics of the market? We do have topping patterns in the S&P500, the Nasdaq 100, the ASX200, AUDJPY, AUDUSD and Crude. Thus for me I would be using decent bounces into the end of August/mid September to really position on the short side. The best times to be short are never after the initial panic as I keep saying.

Thanks
Austin


Thursday, 11 August 2011

The Test

Morning All,

The volatility continues. I said yesterday that I was out of stocks as the snapback trade had played out, and that I would welcome any overnight retest of Tuesdays lows. Well here it is. To me, it seems everyone sold the bounce in a deemed "dead cat bounce" last night. This is now setting up some great test trades and double bottom trades in Asia today.

The SPI is indicted around 3995/4000. I could see us testing 3970/3975 pretty quickly on the open. I will look to buy this level first and ff this level does not hold, there is room to fall all the way down to  3900/3875 so be nimble and willing to short intraday if we don't hold early. For the bigger picture traders, the next 2 days are great buy opportunties with stops vs Tuesdays lows. It is that simple really to me.

SPI 5mins
These are the intraday levels for the SPI. I don't think we will retest Tuesdays lows so I am looking to buy the Fib retraces. It goes without saying- be nimble.

Given the hammer and bullish reversal out of the 61.8 fib level, you have to buy this dip in Australia to me today offering a great risk/reward trade. Note what happened in March 2010 at a similar juncture with similar characteristics.

All Ords Daily March 2010:
Note the hammer, 1 day follow through followed by a retest of the low that held. I think this is where we are at.

And now:

I am also looking at 1115 and 1100 in the S&P Eminis. We will see pullbacks today of course across Asia and I would be looking for test trades across these markets.

Thanks
Austin

Wednesday, 10 August 2011

What A Day

Yesterday was one of the best trading days of my life. No one likes a gloater but I do think reflection is really important for development and for reaffirming all the positive things we do in this trading game.

Everyone was doom and gloom yesterday. People were talking market crash, runs on banks, P3, forced liquidation etc etc. Now I am not saying that I was not immune to these fears but the simple matter of the fact is that I have been here before and I know these moments present huge opportunities doing the uncomfortable thing. As a trader you have to think differently from the rest and really understand how the market works. The best time to be short is never AFTER a panic move out of the high. You have to to do the analysis, have a plan and put emotion to one side.

If you believe in the power of technicals than all the news and rumours should mean nothing. I titled yesterdays post 1102. The low for the S&P500 cash last night before a 70pt rally was 1101.60! Technicals mean nothing you say? It is all about how you manage yourself. I just sold my long emini position at 1176.50 for a huge overnight gain (I think my biggest ever). Look at how the All Ords reversed out of the 61.8 fib retrace. The papers will give you this reason and that reason for the rally but the simple matter of the fact is that this level was right there for you BEFORE the event happened.

Here is yesterdays post before the huge reversal: http://swingtradersedge.blogspot.com/2011/08/1102.html

So the snapback has occurred and we have seen a 3% gap up today in Australia. I have just sold the long basket of stocks purchased yesterday. I am sure I am probably early but the trade has played out. The market will do 2 things here I believe- we could retest yesterdays lows once more and this would present a great buying opportunity. If we do not get this test tonight in the S&P500 then I think we will grind higher for at least a week or so and look for targets of 1200/1220 S&P500 and 4300 ASX200. We also have strong hammers in confirming markets such as Copper and AUDUSD. This market is set for a good bounce in coming days/weeks so get positioned if there is any panic retest tonight.

ALL Ords Daily:
The low right on the 61.8. This market has put in a BIG swing low.


S&P500 Daily:
The low right on the 38.2 as forecasted at 1102


Eurostoxx Daily:
The low just beyond the 61.8 retrace. I have used the Jan 2010 high here


There were similar reversals across Asian indicies yesterday. Hong Kong and Australia staged the best recoveries from ideal levels. For now we are holding the morning gap but there has been little additional gains from the morning opening thus I am am short term cautious. However, any overnight panic would present a great buying opportunity as a good short term low is in place.
Thanks
Austin

Tuesday, 9 August 2011

1102

Morning All

(UPDATE 14:00 Sydney time) Australia is surging after the All Ords clipped my 61.8 retrace level. We will see a big hammer on the close. I got stopped out of my S&P futures but re-entered at 1090. I have bought the basket of long stocks in Australia as I said this am. Now we await Europe. Cmon

I wake up to see the S&P500 -6.66% (spooky hey). Last night I highlighted 1145/1150 and then 1100/1105 as the targets for this move lower. I didn't expect the latter levels to get hit so quickly but hey, this is panic. Have a look at an intraday chart of the S&P500 and you can see how sharp the moves are when these levels break. Once again, it is a day traders dream so keep trading the levels.

I could show hundreds of charts showing how broken this market is but that is not of value. I could list a thousand things that scare the hell out of me and that is unnerving this market. However, most of that is mere hindsight now and we are dealing with the now. I will keep it very simple- I am buying the market here at 1105 futures. It is Tuesday (my reversal day), we have hit the 38.2 retracement level. Everyone is scared shtless. It is thus time to put on a small low risk trade and add if we see confirmation.

These are the levels:
S&P500 1102/1105 (38.2 retrace from 2011 high to 2009 low)
ASX200 3800/3850 (61.8 retrace from 2011 high to 2009 low)
Eurostoxx 2250/55 (61.8 retrace from 2011 high to 2009 low)

These should be formidable. This is what happened in 2007 after the initial panic off the high:

SPX 2002 Low to 2007 High
And if we zoom in at this area:
And now:


No doubt this is bottom fishing. However, I am playing a simple level with the right stops into panic. I would do this time and time again. In Australia today I have pulled up a number of levels in leading stocks and will be looking for these to hold in the first 30mins. If they hold, I will also be buying a basket of stocks for a small position and adding if we seeing confirmation in the next day or so. Keep it simple. Of course it all looks horrible and there is blood on the streets thus the longer term traders need to see confirmation BEFORE getting long.

Austin

ASX200 Daily: