

This is my first post on this new site and it couldn't have come at a more interesting and opportune time in the marketplace. I really hope you enjoy some of the analysis presented here and I would really value any feedback going forth.
My predominant focus is the Asian equity markets. However, I wanted to begin by giving a thorough overview of key international indices given the events on Friday. The US benchmarks all closed up despite a plethora of negative headlines- a lead indicator to me that this market is possibly now sold out. However, volume was rather weak and breadth closed at 2:1 advancers which is not particularly impressive and does not hint of a major low just yet. The Dow Daily hit the rising 55ema and held the uptrend line, whilst the S&P 500 also hit the 55ema at 1293 and held. The trends remain intact on the Daily time frames.
DOW Daily:

The key chart to me at this stage is the S&P 500 60mins. Fridays low was right at the open gap target of 1286/1293 and price bottomed in the first 30 minutes of trading rallying all the way into the close. This is positive action and a short term range has now been established between 1292/1293 to 1310. The June Eminis were a lead indicator for the positive session where the market bottomed at a perfect A=C, a corrective complete move. In the very short term, I think we may see more consolidation/basing and a retest of Friday's lows before any new uptrend can begin. Ultimately, strong breaks of 1310 should be bought for a new swing back up. Momentum has failed to follow through to the downside and possible bullish divergences are in place. Thus, given the great supports that have held and given the nature of the price action, I believe buy setups should now be considered with stops below 1292/1286 depending on your time frame.
S&P500 Cash 60mins:

Emini June 60mins:
A=C move down hit. It can be argued that this is a triangle breakdown but I feel this is the less likely scenario for now unless 1292 on the S&P 500 Cash breaks

The Nasdaq 100 is certainly trading right at a major neckline. I am sure there are many technicians who will be calling for a potential Head and Shoulders pattern here. As a word of warning, my experience is that Head and Shoulders patterns are some of the worst performing climax patterns and I have made considerable amounts of money by fading these classic setups. However, no doubt we are at some major supports here that need to hold.
Nasdaq 100 Daily:

The Eurostoxx has formed a great potential A=C corrective move down and is thus ripe for a new swing back up soon. Note that this has also formed what I like to call a "failed breakdown" setup- traders have all shorted on the perceived break of support at 2920/2900 and any failure to follow through to the downside could trigger a real bear squeeze. The key here is momentum as this whole move down over the last week or so has lacked momentum and no new indicator lows have been made. Momentum precedes price. Any rally back above 2920 (the open gap on the March futures and previous support) should be taken as a buy signal for a strong swing back up.
Eurostoxx March 60mins:

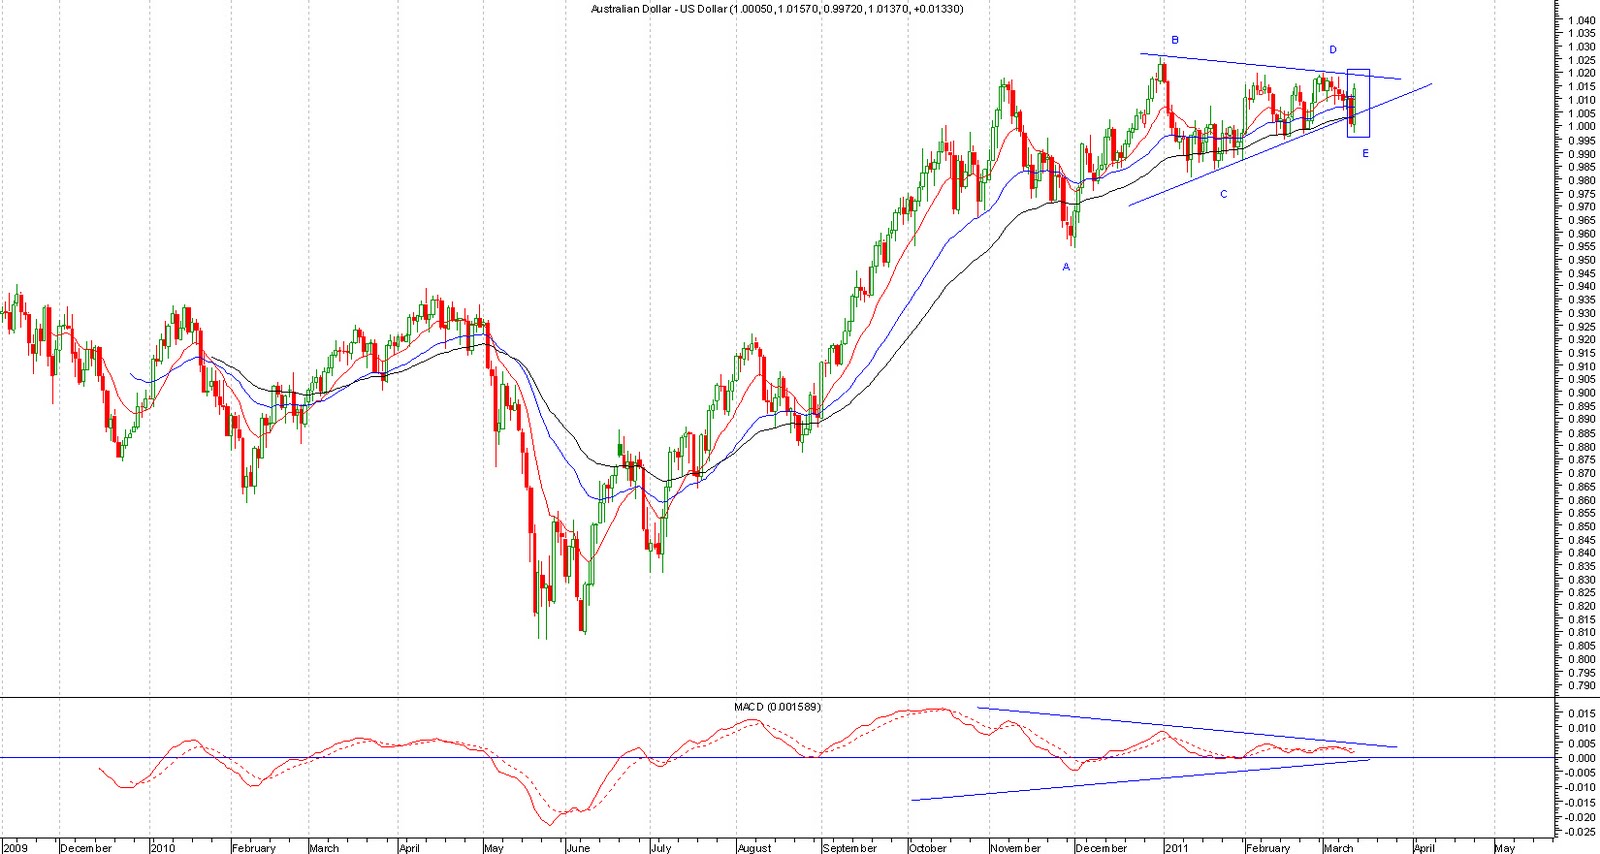
Turning to currencies, the way AUD traded on Friday night is indicative of a major turning point and market low to me. Initially, the USD caught a strong bid on news of the Japanese earthquake and no doubt due to continued concerns in the Middle East. However, AUD fell right into great supports and staged a huge rally triggering a major short squeeze. 4/5 days of weakness were erased in a few hours. The Daily candle closed very strongly right at a major Daily trendline. The fact that AUD showed such strength despite huge global upheaval is sending a very loud signal- this market does not want to go down. 1.02 is major resistance and longer term traders should be establishing positions on a break of this level. Shout out to Rich at http://marketletters.blogspot.com/ for successfully anticipating this setup. The key to understand is that AUD has now spent some 4/5 months in a major consolidation pattern and a relatively tight range. Ranges precede price expansions! I feel that when this pattern does break out, we will see a strong move indeed.
AUDUSD 60mins:

AUDUSD Daily:
Finally, Dr Copper has also formed a great potential "Failed Head an Shoulders" pattern. Once again, when copper intially broke through horizontal support it seems momentum traders jumped on board. However, price failed to follow through to the downside and reversed strongly forming a strong hammer candle right on the neckline. Note that there is also a perfect A=C corrective move off the high in place. If we see another strong close back above the neckline, I believe we will see a swing back up to the highs.
Copper Continuous Daily:

In Sum, it seems that traders panicked on Friday due to major "news" headlines. These initial losses were all recovered with some markets such as AUD staging very strong rallies. I believe this is all the beginning of a potential base for a new swing higher. For now, the S&P 500 Cash is trading in a clear range from 1292 to 1310 and I think we may need to make some kind of retracement of Fridays move before any strong rally can ensue. 1310/1315 is key resistance. The Eurostoxx is a buy above 2920. I believe lead markets such as AUD and Copper are sending bullish messages.
Obviously my heart goes out to all those effected by the earthquake. No doubt this is a tragic event and difficult to fathom. Unfortunately, our business as speculators is what it is and we must continue our way in a disciplined manner as ever.
Thanks. I will be posting my Asian market thoughts before the open tomorrow
Austin