

I love Fibonacci. Last night the S&P500 futures topped out perfectly at 1254, right on the 61.8 fib retracement from the May high to the recent lows. Remember the panic low that occurred at 1102 on the 38.2 Fibonacci retracement? It was posted here ahead of time. I really hope that the charts shown here illustrate how powerful this stuff really is.
I believe there is enough evidence out there to call a short term high in place. I have been calling for a intermediate rally for some time now and this has been a great call: http://swingtradersedge.blogspot.com/2011/10/double-bottom-take-2.html AND http://swingtradersedge.blogspot.com/2011/09/intermeadiate-low-is-in.html
However, we have got to my targets in the S&P500 and DAX very quickly indeed, much faster than I had anticipated. Thus, I don't think this market has had enough "time" to call the bigger top in place but from a trading perspective, price is now ripe for the first major pullback since the October low was formed.
Firstly, the S&P500 has put in a bearish reversal candle right out of resistance and the 61.8. This is ideal confirmation for a Daily high. I think the pulback will be choppy and am looking for a move down to 1150-1175 in the coming weeks. Great risk/reward Short.
SPX Daily:

I see a number of complete 5 wave advances across Equity markets. The rally is done or has a squeaker new high to be made.
ASX200:
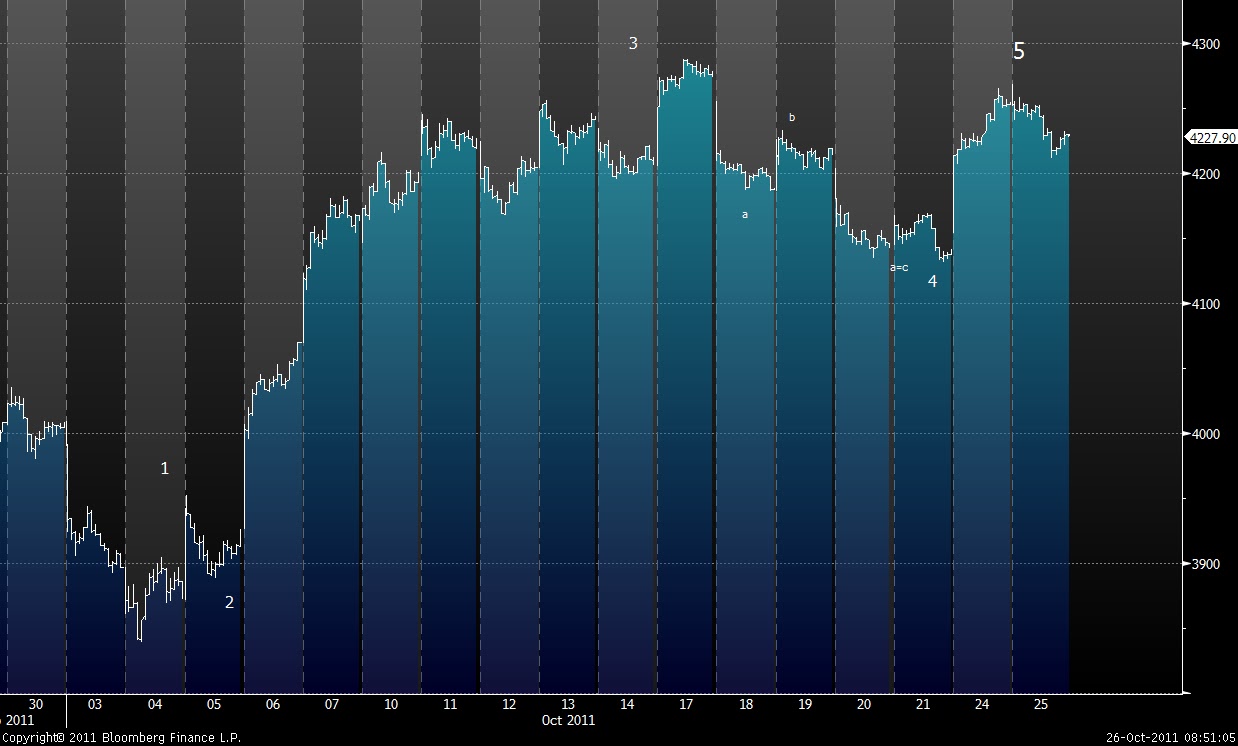
Hang Seng:

DAX:

S&P500:

In all these markets, there are strong bearish momentum divergences and waning breadth indicating a tiring trend.
I also found it very interesting that the DOW topped out last night right at the 200day moving average (not shown). This is exactly what occurred in 2008. The market continues to follow my parallel and pls see below. However, this rally has been a lot sharper and quicker, and I do think we need more time before the bigger picture high is in. The S&P500 200ma is still up at 1270 area and I think this will be hit later down the road (mid to late December).
S&P500 Parallel:

I should also note that the bearish sentiment extremes have been unwound. This recovery phase has resulted in key sentiment indicators such as the VIX and CBOE put/call ratio to move well away from bearish extremes. I am sure this also coincides with a huge unwind of record short positions. What is the path of least resistance now?
In sum, the rally off the October lows is in its late stages. There is enough Daily evidence to suggest a meaningful high for the next few weeks. The easiest part of this rebound is over. This is a traders market and use bounces over the next few days to position short vs stops above 1260. I think this is a monumental buy the rumour, sell the fact
Thanks
Austin