A relatively good recovery overnight in the S&P500 but once again on woeful volume of less than 500m on the NYSE. As I said yesterday at Emini 1245, price is trading right in the middle of the range so there is no clear trade. Last nights bounce once again takes us to an interesting sell area. Given the time of year however, I would advise caution and only very small nimble positions.
S&P500 Emini 5mins:
Price has now rallied into the 61.8 and previous breakdown zone. Nimble traders could initiate shorts here with stops above 1260 or above 1265. There is a potential ABC move off the low but I would hold this count with suspicion given the volumes.

S&P500 Daily:
This really is the key chart to bear in mind. Price is "testing" against a number of overhead resistance levels in this zone. This really is a faders dream with the correct stops. Ultimately, we could be look at an ascending triangle here with a breakout either way come the middle of January.
I imagine trading in Australia will be very subdued. Yesterday I said "We are now approaching the low end of the range so it is time to lighten up shorts." Certainly the low of 4018 was not one of my cited levels but the strategy appears to be playing out given we are indicated at 4070. I think yesterday was a perfect example of when reading the tape is of central importance over technicals/levels etc. Indeed, when 4030 dropped, it looked like we were set for a breakdown into 4000. However, genuine size appeared on the bid at 4020 and 4018, by far the biggest number of contracts we had seen on the order book all day. Furthermore, the "breakdown" through the intraday lows occurred at midday, which has a high probability of failure given that volumes dry up at this time of day and there is a lack of conviction. All this aligned for a low and rally in the afternoon session. Reading the tape and understanding the character of the market is so essential in these moments.
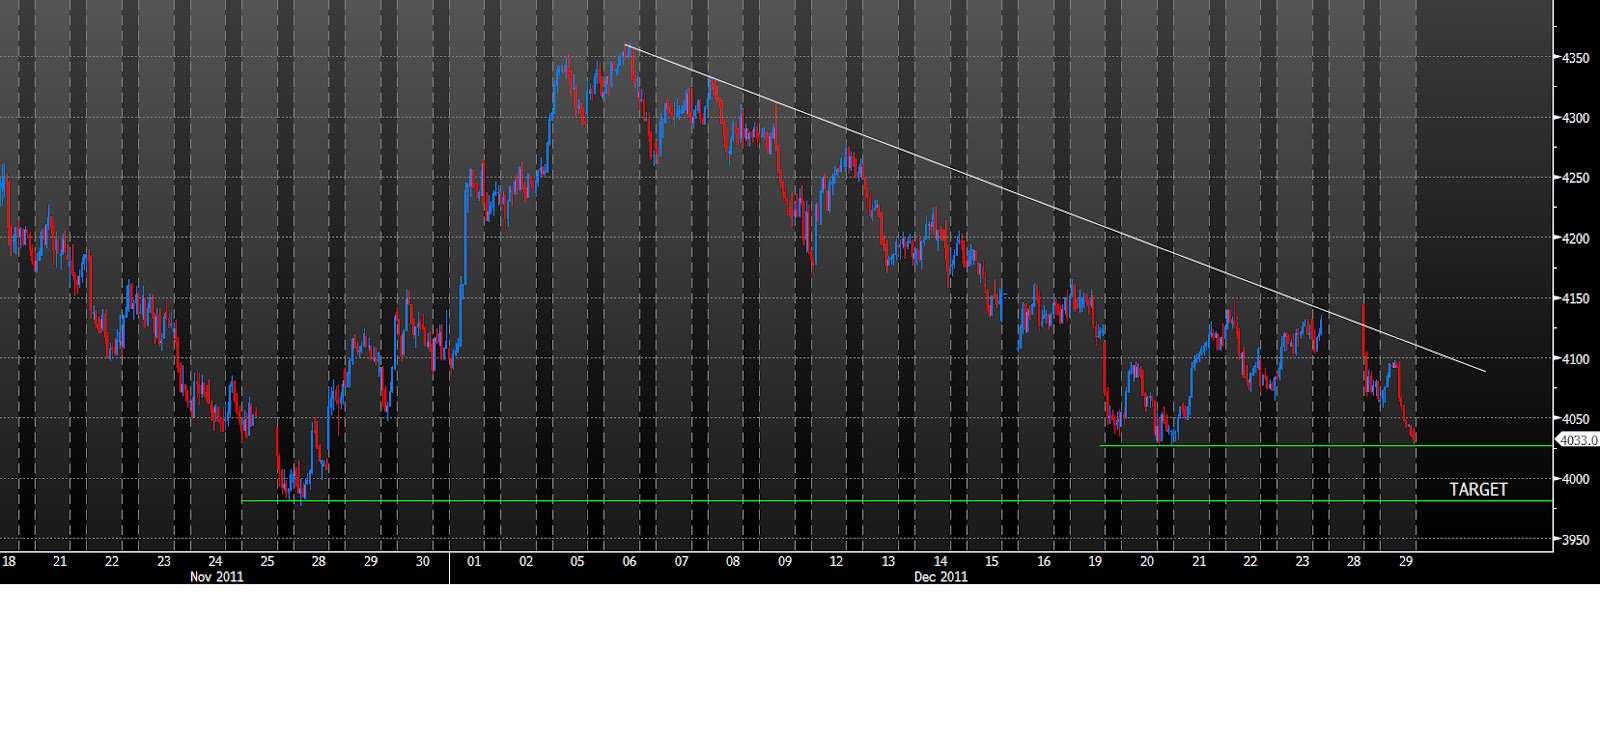
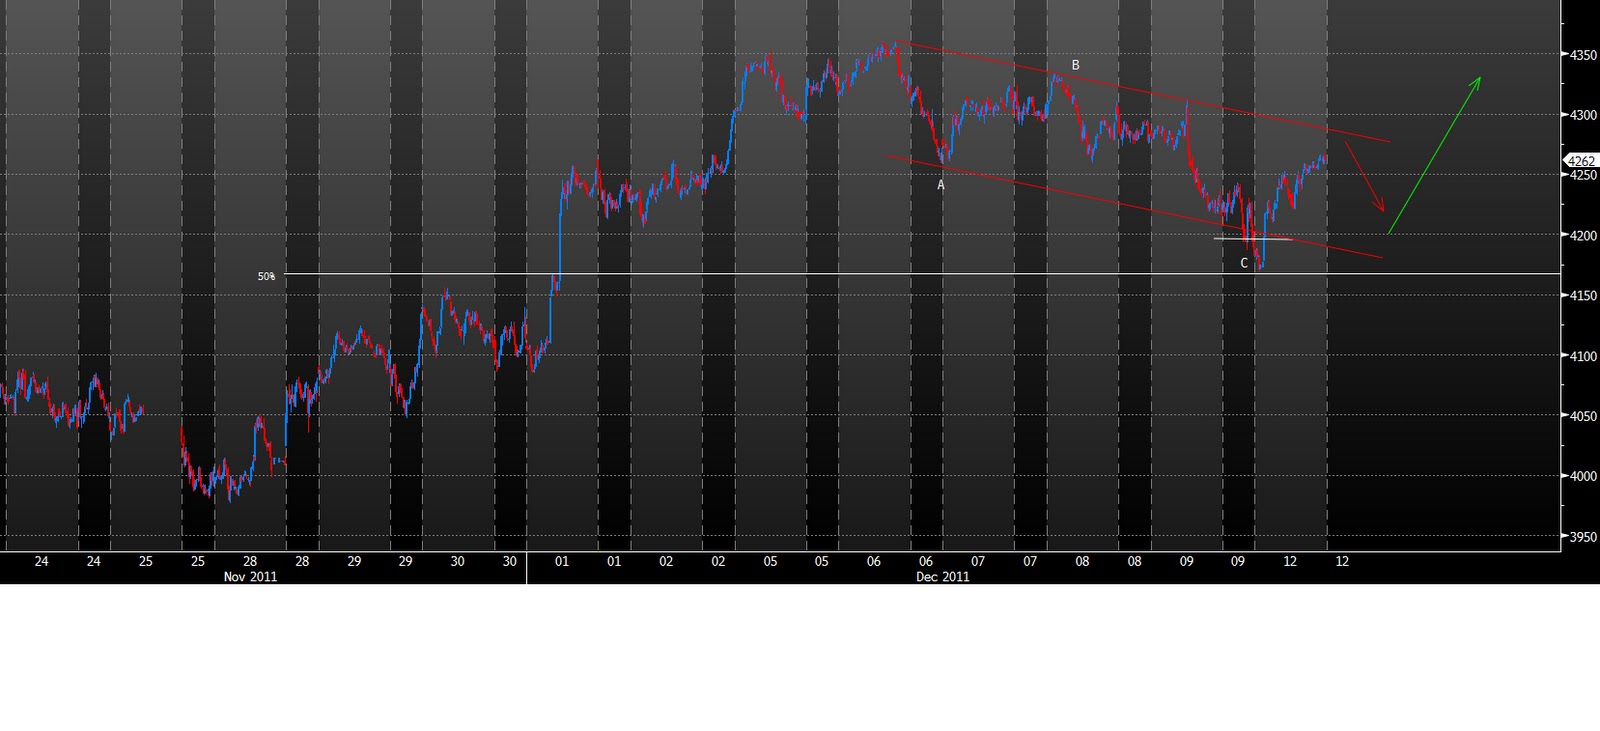
SPI Continuous 60mins:
This was my target zone yesterday and we have seen a good initial bounce. I really don't know if we have seen the swing low yet and I probability doubt it given the day of week and lack of volumes. Ultimately, the strategy remains to cover shorts in the low 4000s and turn more bullish if this market breaks 4150 to the upside and a higher high is made. The range and boundaries are clear.

My range today: 4045 to 4080. Outlier levels 4020 and 4095
My day trading plan today: We are looking at a small gap up to 4070. Thus, the SPI is now re-testing the previous 4065 breakdown level. This is a great fade/short level straight up with tight risk. Thus I will be looking to SHORT early with stops above 4080. Any sell off should be capped at 4045/4050 today I believe given the lack of volumes and holiday season. I am not expecting any strong trends and will continue to scalp the cited levels appropriately.
SPI 5mins Day Session:
Retesting the previous breakdown zone of 4065/4070 thus got to short first thing.