Morning All,
I want to keep this post really simple- right here, the high probability trade is to sell this retest of the breakdown level.
I am working under the assumption that we have seen a climatic intermediate high in the SP500. We had the Double top pattern out of 1370 and clear price confirmation on bearish breadth and volume. There are so many other patterns across markets illustrating a meaningful high but I will not recount them all again here. Most importantly, price broke through meaningful support levels on increased momentum. Thus our highest probability trade is to sell the first retracement/pullback looking for a retest of Tuesday lows at a minimum (but I think we trade lower than that).
Let me illustrate through the charts:
S&P500 60mins:
Price is now clearly trending down with a new momentum low in place. Thus, I am looking for a reversal out of those downward sloping moving averages, targeting the 1330 to 1335 support zone at a minimum.
I have also shown my count once more for this index. That back to back 4th wave flat was the key precursor to this whole sell off. Price has hit the first target of the 4th wave of minor degree, but given the momentum and other technicals, the deeper target of 1330 to 1335 is in play.
S&P500 15mins:
I have zoomed in on the key resistance areas here. We are now backtesting the 1350 to 1355 previous support area and this provides a great low risk short trade, stops above 1365. Note there is an outlier level at 1360 which is the 50% Fib retracement off the top. Any move above 1365 would invalidate my bearish stance and setup.
In sum, I am looking for this bounce to run out of steam in the 1350 to 1355 area. I have just re shorted a small position and will increase size if I see more confirmation. Keep following this move lower. Stops should be above 1365 i.e. the big strong down night.
Adding to my analysis is the AUD. Price is now also retesting the previous support area and provides a great low risk short setup.
AUD 60mins
Clearly we are in a 3rd wave lower on increased momentum. I have no idea if this 3rd wave low is even in. Irrespective, we have to look to get into this downtrend and this zone is a confluence of res areas that should contain price.
Australia is clearly impulsing to the downside. Yesterday we saw clear confirmation on the Daily chart that this multi month consolidation pattern has ended with back to back strong bearish closing candles. Not sure what else you need?
ASX200 Daily:
And I will also re show my count that I have maintained for a while. I believe we are now in the beginnings of a new trend lower that will re target the previous lows in the 3800 region and possibly lower. Obviously I don't want to get ahead of myself, but this is the forecast.
ASX200 Daily Count:
Successive lower highs in a multi month consolidation pattern. Clearly price has failed to break out. The path of last resistance is now down. Let the bulls pay.
So in the short term we are clearly oversold and coming into the low end of the recent range. However, my experience has taught me to not fight these strong down moves. This is where the real money is to be made. As we saw yesterday, price tried to rally all day only to be absolutely slapped with an hour to go, breaking through the intraday lows. This is not a vote of confidence.
The chart below merely shows potential targets or stopping points. The key to me is to follow the trend lower until we see a clear basing pattern or bullish divergences. None of these are in place yet.
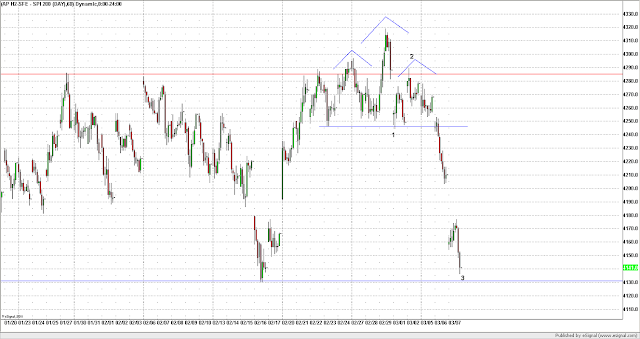
SPI 60mins:
We are now coming into the low end of the recent range in the 4130 to 4140 area. However, this is clearly a 3rd wave move lower and thus picking bottoms right here is not wise for now.
My SPI day trading range: 4131 to 4165. Outlier levels 4100 and 4175/4180.
My SPI day trading plan: Obviously the tone of my post this morning sounds rather bearish. I am aware of this and perhaps this is indicative of how everyone else is feeling and indicative of a big bear trap. I will keep this in the back of my mind. We are indicated at 4160 early given the overnight bounce. This is right back into yesterdays breakdown area. Thus I will be looking to short fade early in the 4155/4160 area with stops in the mid 60s. If we fail to sell early, this opens up the potential for a retest of yesterdays highs at 4177/4180 where I will also short fade more aggressively. I will look to get out of shorts in the low 4140s and then 4131 (the 61.8 Fib retracement from the recent high to the last major swing low on 30th December 2011). I will potentially look for long trades in the low 30s IF I see some bullish 5min reversal candles. The key is to follow the trend at this stage. So many markets such as the Hang Seng and the Nikkei are trending lower in 3rd waves so no need to fight this for now .
SPI 5mins:
Sell a retest of the 4155/4160 level.


