

As I analyse the global indices today, I am amazed once more at the influence of this seasonal window. So many markets have turned right into this and I think the evidence is growing for a significant top.
Firstly, let me show over the last 10years how the S&P500 has traded around the month of March. Lots of charts here but really this should be quite easy to scan through.
S&P 500 Daily March 2000:
The big 2000 market top that ended the tech bubble. Where did the S&P500 peak? Right into March. A initial 200pt panic sell off ensued.

Where did this initial sell off bottom? Right into March 2001
March 2001:
March 2001 proved to be a strong intermediate low. A 250pt rally followed.

March 2002:
March 2002 topped out a countertrend rally. A destructive sell off followed from 1175 down to a panic low of 780!

The wave 2 low and bottom of the bear market was....right into March 2003
March 2003:

March 2004:
Although not topping out the entire Bull market, certainly March 2004 led to an intermediate high and a 6month sell off from 1160 to 1060 followed.

March 2005:
Again, another important intermediate high right into March 2005. The market sold off quite sharply from 1230 to 1140.

When did the first rumbles of the US housing bubble emerge? You guessed it, March 2007. This time was associated with a panic low in the S&P500.
March 2007:

March 2008:
In 2008 we were on the onset of a crisis. The market put in a intermediate low back then in March 2008 as BEAR STEARNS was bailed out by the FED. Bearish sentiment was at a fever pitch at this point- cue bear squueze.

March 2009:
And just when things seemed their worst, just when it seemed like the financial world was ending as we knew it, the market bottomed in March 2009.

March 2011:
The Japanese earthquake led to a market top in February thus a bit earlier than the window. However, after a 100pt sell off, sure enough we bottomed right into March.

And so here we are now in March 2012. Bullish sentiment levels are at extremes. Underlying momentum and volume despite the run up has been deterioarting for many months. Each new high has produced weakening breadth readings. And finally we have seen a small pullback. Will this produce something more meaningful? I am betting it will.
S&P500 2012:
The cash high was 2nd April (futures high was 27 March). The correction thus far has been roughly 60pts. If history is any guide, expect a whole lot more down the line.

A quick look at other markets shows interesting tops right into March as well. The sell offs look impulsive.
Eurostoxx Daily:

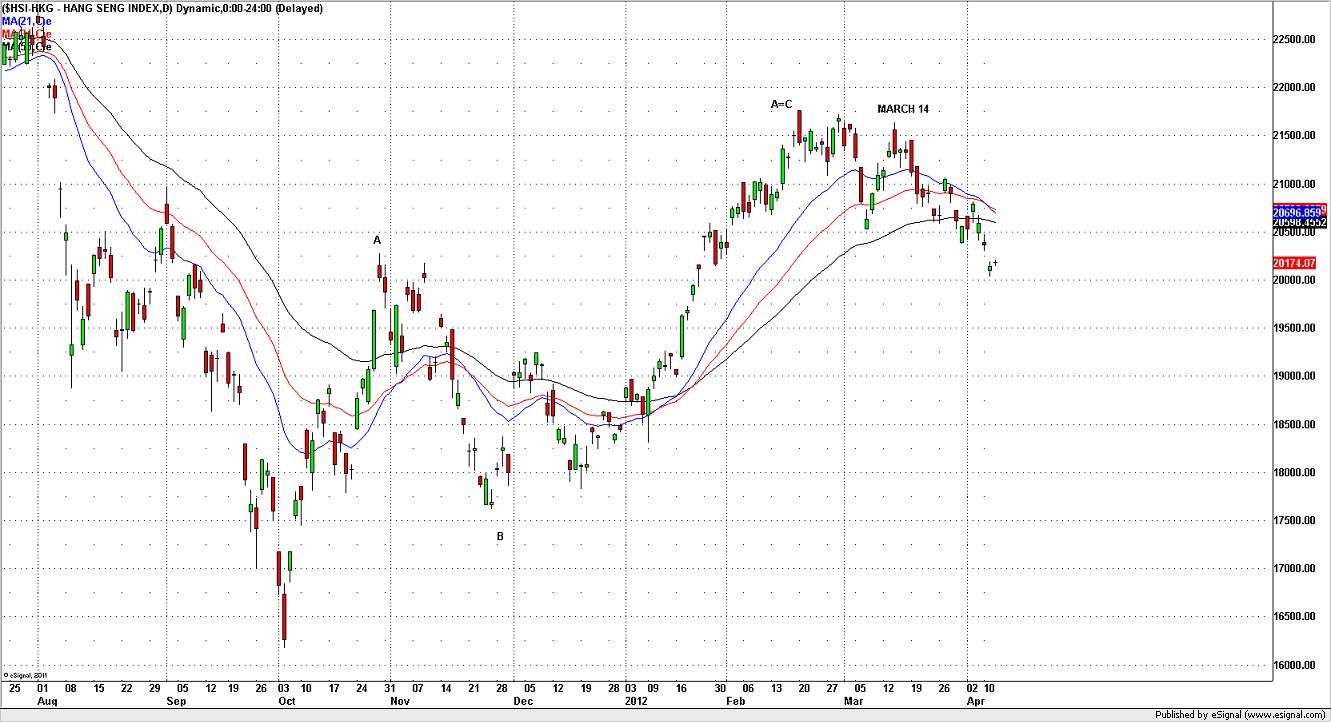
Hang Seng Daily:
Nikkei Daily:

BEWARE THE IDES OF MARCH.


