Happy Weekend All,
One of the best lessons we can learn as a trader is to heed price action. I showed a number of resistance levels across multiple markets on Friday right at the 61.8 fib retrace levels. This was a great area for the market to sell and to consider short setups but it just did not play out. There was no confirmation and US markets seemed to brush these levels aside with ease. We must be flexible enough to respect this. One of my favourite quotes is from Paul Tudor Jones, where in response to why he was no longer bearish on the market he stated, "the market didn't go down. The first thing I always do is put my ear to the railroad tracks." No doubt one session does not make a trend but it certainly didn't seem that the market wanted to go down on Friday night despite the plethora of resistance levels. Thus, we now must continue to focus on this trend up once more. I managed to successfully identify some great basing patterns off the lows, http://swingtradersedge.blogspot.com/2011/03/s-bullish-patterns-developing.html, and now it seems we must identify methods to enter into this newly established trend. If this turns out to be a more complex correction (such as an ABC X ) then so be it but we cant forecast that.
Breadth was once again rather weak and there was no volume supporting the move which makes me think that we are not on the cusp of a major breakout until some more consolidation ensues. However, breadth studies should always be a secondary consideration after price. The trend is up on the S&P 500 Weekly, Daily, 60mins, 15mins and 5min charts- this is no doubt a powerful scenario and which should respect this.
S&P Cash 60mins:
The S&P 500 60mins closed right at the open gap making a new momentum high. The ideal trade now is to buy a pullback into the moving averages with a stop below the recent breakout levels i.e. below 1305/1300. There is a possible wedge pattern and if this triggers we could get that sell off back down to a great buy zone
Nasdaq 100 60mins:
The Nasdaq has rallied right into a downward sloping trendline on strong momentum. Day traders could potentially fade this in the very short term but the better trade is to buy any swings back into the moving averages with stops below the horizontal line shown here. Note that the daily has triggered a bullish "failed head and shoulders pattern" which is one of my favourite plays.
The ASX200 closed just shy of the 61.8 retracement level and has rallied almost 300pts in 7/8 trading sessions. I missed a couple of key long entries into this trend above 4700 and now I am on the sidelines and waiting. I do think we need to see some consolidation/ a deeper pullback first before getting long once more as the risk/reward just does not favour it up here for swing traders.
ASX200 Daily:
I have been monitoring this market for a while and now I think it is suitable to show what I deem to be a very bullish pattern emerging in the Shanghai Composite. This market has been in a clear sideways pattern for a year and it now seems to me we have put in the E leg of a triangle. Despite the panic throughout Asia on the earthquake news, this index put in a very constructive hammer right on the moving averages and has begun to rally once more. I feel this will be a major position trade as we breakout of this pattern. Monitor this! As an example, see the pattern on the Hang Seng Daily that emerged in 2010 and the ensuing breakout. This is almost an identical scenario.
Shanghai Composite Daily:
There have been some great trades in this market despite the bigger picture sideways action. Study the inverse Head and Shoulders pattern as well as the wedge breakout. I think a strong breakout of this triangle pattern is now in play. Get long prior to the downward trendline and add on confirmed breakouts above.
Hang Seng Daily 2010- Triangle Breakout Comparison
Hang Seng Daily Current:
The Hang Seng is clearly building another consolidation pattern ABOVE a previous breakout/res level. This is bullish. We have either already completed an ABC Flat down or a triangle is still basing out. Nonetheless, focus on the bigger picture bullish patterns.
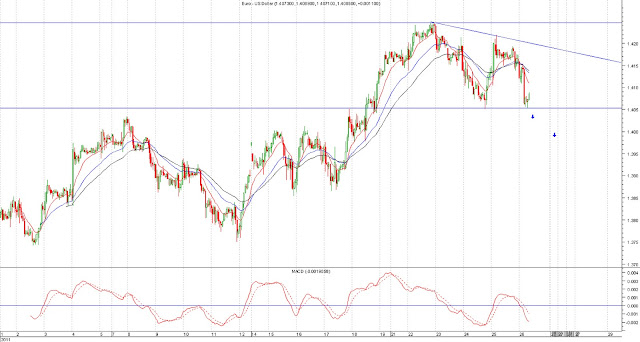
I got short EUR just below 1.42 in line with my trading plan: http://swingtradersedge.blogspot.com/2011/03/usd-big-picture-double-bottom-trade.html. This has worked well initially and we saw quite a sharp fall on Friday night. As per the chart below, we need to break 1.40/1.4050 to see increased momentum to the downside. I know that a strong USD and Equity market do not go hand in hand but I have always found it more profitable to trade the setup first and then react according to the underlying price action rather than trying to over think. EUR has topped nicely and trended down in line with my double top pattern despite equities continuing their strong run. Anything can happen. Something will give at some point but keep following the price.
EUR 60mins:
DXY Spot Daily:
In conclusion, the Shanghai composite and the Hang Seng appear to be breaking out of big consolidation patterns. These are longer term bullish plays and anticipate strong trending moves out of these patterns. I am sure this will have a positive read across for the rest of the region in the coming months. US markets continue to grind higher and our strongest trade is to buy a retracement back into the breakout levels. Despite this, I am short EUR and am looking for breaks of 1.40 to add.
Thanks
Austin


