Thursday, 26 May 2011

Day Trading Gaps

I thought I would write a post match analysis given that today was an ideal illustration of my morning Gap strategy. I called this out on twitter throughout the day but I thought now would be an opportune time to go through this more thoroughly. As I said the other day, I am in the process of drawing up a Day Trading programme and setups like this are an integral part of my Day Trading plan.

From the outset, nothing here is particularly new or revolutionary. Countless traders have devised strategies on opening gaps and morning breakouts most notably T.Crabel and M.Fisher. This is my take on what works for me through my own testing and experiences trading the Australian market. It is very very important to have a plan to trade these morning moves as they often set the tone for the rest of the day.

A Gap occurs when the cash session opening price is greater or lower than the previous days cash session, creating a "gap" in price levels on the chart. Given the futures markets are almost 24hrs, I always have my SPI futures chart setup to mark the beginning and end of the DAY session only to show these gaps. I switch off the night session trading which is based on a completely different set of influences. I suggest you do the same if you are an Australian Day trader.

Gaps represent emotional extremes. To me, they are so important because they tell us a lot about the upcoming market action for the day and offer great trading opportunities. A strong gap up that holds and consolidates in the morning is bullish, setting up strength for the rest of the day. Conversely, a gap up that finds little support or buying interest in the first 15mins is a candidate for a pretty sharp reversal. In essence, a gap is either going to hold or it is going to fill. Keep it simple. Have plans for trading both.

Here is today's intraday chart:
SPI June 5mins:

As per my twitter feed, I went long at 4634, sold half at 4645 (at the previous days high which was v.v. lucky) and then held rest for end of day getting out at 4655. No doubt there are areas for improvement and subsets of trading this, which is also partly the reason I write this.

The system in essence:

Entry- 2 ticks above the morning range. Range is defined by the first 3 opening candles
Stop- 8 to 10pts. Need to give it enough room without risking too much. 
Exit- Hold to close. Partial out if need be. 

Here is what transpired: 

1) Entry- Wait for 15mins to trade and for the first 3 five minute candles to close. Note the very strong opening 5min candle today was a lead indicator of genuine strength. I then place a buy stop 2 ticks above the intraday high and a sell order to short 2 ticks below the intraday low. Filled at 4634. There was no indication at all from price that this gap was being rejected. (Some traders would like to go earlier. Again, this is what works for me).

2)Sold half at resistance- only a small initial move but I like to immediately lock in quick gains especially into yesterdays overhead highs on a partial amount. However, the key is to hold at least a partial to the close. We are aiming for a strong trend day.

3) Retracement and then 1.30pm breakout to upside once more. Aggressive traders would have seen that the 30s dropped but soon recovered. There was a small trendline break thus could have added/bought back here.

4) Break of intraday highs at 4645 setting up a strong run into the close. Add

5) Exit- let the market take you out as it moves higher into the close. This is the hardest thing to do but the KEY for success. Large range days will close at or near the high if it is an up day so you have to able to extract the most amount from this. As L.Williams says "..for short term traders, to catch a winning trade, the most profitable strategy is to hold to the close".


Thats it. This is not meant to be hindsight but a run through of a powerful and simple trading setup. Trades like this happen quite frequently in Asia given the overnight moves so you have to have a plan.

Would value any feedback, comments or questions as ever.
Austin

When the crowd panics, keep your head

Morning All,

On the twitter feed yesterday, there seemed to be A LOT of panic and all the charts that were posted were forecasting huge breakdowns, iii of 3 downs, crash etc. I picked up on particular comment where an astute trader said "IMO everything is looking cataclysmic to me". Now I am not trying to be a hero as picking a bottom is fraught with danger and some of these points raised were very valid. However, the important thing to gauge from this is that in these situations, it is very very likely that the crowd and the market will be FEELING exactly the same. Everybody is looking at the same charts and the collective social mood will be wrapped up in this bearish mentality. This is the worst time to trade. In fact, these are the exact moments when you have to be prepared to do the uncomfortable and fade the crowd. Sure enough there was quite a sharp snap back last night. I believe there is a genuine possibility of a bear squeeze to come.

No doubt I tried to call on a turn on the 16th May and this was short lived: http://swingtradersedge.blogspot.com/2011/05/turning-point.html. However, by identifying low risk opportunities with the correct stops, no damage is or was done.

The S&P Emini futures did break the wedge type pattern I posted yesterday during Asian hours. However, there was a very strong recovery and the downward trendline was recaptured. This is indicative of a solid bear trap. Note also that there are Fibonacci relationships in place between the waves that indicate the end of this corrective pattern. More confirmation is needed but I like this as a low risk trading opportunity. That is what we do as swing traders- keep identifying low risk areas to get into the trend. We never know which one will play out but the winners will far outweigh these small loses as long as you are obeying the stops.

Emini S&P 60mins:


Interestingly, AUD also manged to recapture the downward sloping trendline I had in place. This could be irregular type triangle or a wedge pattern. No matter, we now have a failed breakdown, a bullish inital price reversal, momentum divergences in place and a clear corrective pattern. Low risk entry here or wait for price to clear the downward trendline.

AUDUSD 60mins:


I thought I would quickly show the Australian Sector indices as they are coming into some very interesting areas of support.

Materials Sector Daily:
2 Signifcant trendlines coming in here

Materials Sector Daily Zoomed in:

Financials Sector Daily:
This sector does look rather weak with a lower high in place and a strong thrust lower. However, we are now approaching the low end of the range and a 61.8 fib retracement. Time for a pause and possibly look to buy oversold names on confirmation for a short term swing only.

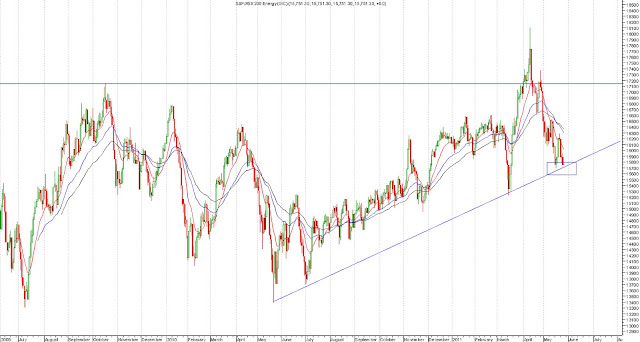
Energy Sector Daily:

ASX200 Cash Daily:


I find this chart very interesting indeed. Firstly, the market is approaching an upward sloping trendline and natural area of support/the low end of the range. This is not the time to be initiating new shorts Furthermore, I have overlaid some simple bollinger bands over the price action (2 Standard Deviations). As you can see, when price closes or trades sharply out of the lower end of the bands, there is a strong buy signal once price closes back into the band. This represents panic as the market loses its head and the rubber band snapsback. We are approaching a similar juncture.


Certainly, this kind of market action across asset classes calls for ALL traders to be incredibly nimble and careful. Don't get married to a position for too long. However, I do believe we are seeing an emotional extreme in the market place which offers yet another great risk/reward buying opportunity. Some markets look quite horrible (most notably China) thus I am certainly not forecasting a strong impulsive move back up to the highs yet. However, being a trader is all about identifying low risk/high reward setups. This is another one of those opportunities soon I believe.

Thanks
Austin