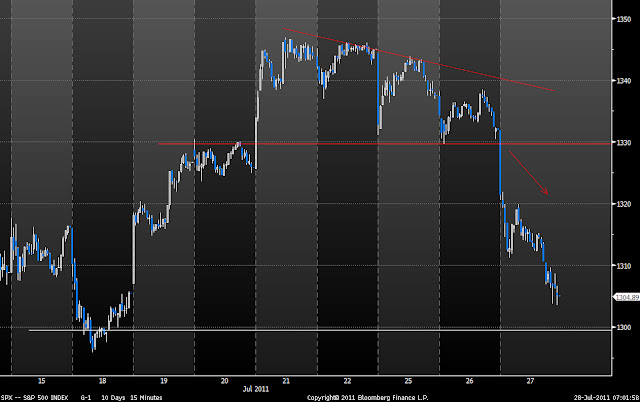
The S&P 500 broke through my short term 1330 support level last night and we trended lower all day. Breadth was very bearish with 1729 decliners to 113 advancers. Expect a continuation of this move tomorrow at a minimum. On Tuesdays post I said "my take on the S&P 500 is that it is trading at the top end of its range. Thus, this remains a fade vs 1345/1350 and look for breakout trades above." This has played out very well given yesterdays move and now we coming into the low end of the range and final supports. I could make a very strong case for a number of topping patterns across markets as the charts below illustrate.
S&P500 15mins:
This was my short term pattern coming into last nights session. Price gapped through the 1330 level on the open and never looked back.
S&P500 Daily:
Price has now sold off sharply from the top end of the range. I am not a big fan of Head and Shoulders patterns but not doubt this is a market that is tired and unable to break higher. A close below 1295/1300 would seal this I believe.
Nasdaq 100 Daily:
This is also a clear topping pattern. Megaphone top/Triple Top/Failed breakout- call it what you want but this market has repeatedly failed at the previous highs at top end of the range.

Crude Daily:
I talked about this pattern some weeks back and now is an opportune time to update. This looks like a countertrend wedge pattern back into the previous breakdown level and the pshyc 100 level- a great low risk short area.. Price has closed below the wedge and look for confirmation that this market is spent.
EURUSD
Some of my favourite trading setups are failed patterns. I read so many blogs of late about the "downward trendline" in EUR. Sure enough we have seen a breakout and complete rejection back into the range. This is also the 61.8 retrace level, a great area for a genuine high. Note the engulfing candles highlighted in the rectangular box. It is also interesting to note that AUD has surged into the 1.10 level and is setting up a great potential Double Top. It looks climatic to me but there is not enough confirmation yet.
This does not have a great read across for Asia. I have shown a number of bullish and bearish setups across the region in my recent posts: http://swingtradersedge.blogspot.com/2011/07/mixed-story.html.
If Singapore and India fail to hold their respective breakout lines, it is likely to mean the high for these markets also. China remains in trouble. Australia is holding its previous lows for now but there is very little conviction as I write. There is no volume and nothing being done by funds.
In sum, I have 1290 to 1300 as the final supports for the S&P 500 (pls read below ) so short term traders could be lightening up shorts into this zone. I would expect a test of these levels at a minimum coming into tonight. We are still in a range so there is still a possibility of the market holding at these support levels but the overwhelming backdrop looks bearish to me.
Levels to watch:
S&P 500 Cash Supports
1295/1296- Prev interim low on 19th July.
1295- 61.8 retracement off June low.
1285- A=C move off the July high.


