Friday 29 July 2011

Gambling vs Trading

Morning All,

Last night we saw a small rally in the S&P500 that completely failed, and the market went on to retest its lows. I expected the market to continue the move down last night at a minimum and this played out. When a market makes a new momentum low, our highest probability trade is to sell the first pullback. That trade worked well and we are left in a position where the market can genuinely do anything. I don't know about you, but given the position of this market, and given the magnitude of the discussions that are going to take place this weekend, I am happy to have absolutely no position. Taking a major position ahead of this event is gambling, not trading.

To me, this market is tired and is showing increasing signs of distribution. Of course, there is a very real likelihood of lawmakers putting something together over the weekend resulting in a equity market rally. The key levels I am watching the S&P500 are reiterated below

S&P500 60mins:
We have key pivot level at 1296/1300 (which is also the 61.8 fib retrace off the June low), and there is a potential A=C move lower target at the 1285 level. If this market is going to hold in, it is here. I am thinking we see one more session of weakness/panic into the low end of this range and then look for hammers etc for confirmation.


Just food for thought. The market is pricing in almost ZERO chance of a default. The overwhelming consensus is that a deal of some sort will get done despite the persistent politicking. I don't necessarily disagree with this. However, given that the market is not positioned for this event, there will be genuine panic if these levels do go and if something does not happen on time. Again, we cannot know in advance thus wait don't  gamble.

I received an email from a reader (nice one Erik) who suggested that a bullish "E" leg of a triangle was forming on the S&P500 Daily. I cant refute this and it would coincide with this final support zone that I am mentioning here. Personally I think this is the lower probability event but I await the price action come Tuesday.

Another Daily chart that is looking interesting to me here is the AUD Daily. I talked about this the other day and we are now seeing confirmation on the Daily of a possible Double Top trade. These are great risk reward trades and you have to be willing to be contrarian in these situations.

AUDUSD Daily:
Reversal candle right out of the resistance area. Get short and there should be immediate follow through otherwise cover.


The Australian market is hanging right on the edge here. This 4450 area have been tested on several occasions and the bounces have been anaemic. I think it is only a matter of time before this breaks.

ASX200 Daily:


India Daily:
I was concerned about false breakouts. Here is the first one in the region. Not good


UPDATE
S&P Futures are getting hit here. Panic into the 1285 support level.

Thursday 28 July 2011

On The Edge

Morning All,

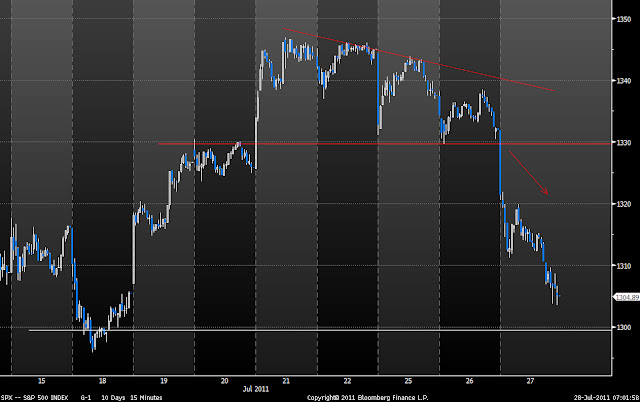
The S&P 500 broke through my short term 1330 support level last night and we trended lower all day. Breadth was very bearish with 1729 decliners to 113 advancers. Expect a continuation of this move tomorrow at a minimum. On Tuesdays post I said  "my take on the S&P 500 is that it is trading at the top end of its range. Thus, this remains a fade vs 1345/1350 and look for breakout trades above." This has played out very well given yesterdays move and now we coming into the low end of the range and final supports. I could make a very strong case for a number of topping patterns across markets as the charts below illustrate.

S&P500 15mins:
This was my short term pattern coming into last nights session. Price gapped through the 1330 level on the open and never looked back.


S&P500 Daily:
Price has now sold off sharply from the top end of the range. I am not a big fan of Head and Shoulders patterns but not doubt this is a market that is tired and unable to break higher. A close below 1295/1300 would seal this I believe.


Nasdaq 100 Daily:
This is also a clear topping pattern. Megaphone top/Triple Top/Failed breakout- call it what you want but this market has repeatedly failed at the previous highs at top end of the range.


Crude Daily:
I talked about this pattern some weeks back and now is an opportune time to update. This looks like a countertrend wedge pattern back into the previous breakdown level and the pshyc 100 level- a great low risk short area.. Price has closed below the wedge and look for confirmation that this market is spent.


EURUSD
Some of my favourite trading setups are failed patterns. I read so many blogs of late about the "downward trendline" in EUR. Sure enough we have seen a breakout and complete rejection back into the range. This is also the 61.8 retrace level, a great area for a genuine high. Note the engulfing candles highlighted in the rectangular box. It is also interesting to note that AUD has surged into the 1.10 level and is setting up a great potential Double Top. It looks climatic to me but there is not enough confirmation yet.


This does not have a great read across for Asia. I have shown a number of bullish and bearish setups across the region in my recent posts: http://swingtradersedge.blogspot.com/2011/07/mixed-story.html.
If Singapore and India fail to hold their respective breakout lines, it is likely to mean the high for these markets also. China remains in trouble. Australia is holding its previous lows for now but there is very little conviction as I write. There is no volume and nothing being done by funds.

In sum, I have 1290 to 1300 as the final supports for the S&P 500 (pls read below ) so short term traders could be lightening up shorts into this zone. I would expect a test of these levels at a minimum coming into tonight. We are still in a range so there is still a possibility of the market holding at these support levels but the overwhelming backdrop looks bearish to me.

Levels to watch:
S&P 500 Cash Supports
1295/1296- Prev interim low on 19th July.
1295- 61.8 retracement off June low.
1285- A=C move off the July high.


Wednesday 27 July 2011

The Waiting Game Continues

Morning All,

Nothing clear coming into today. This market remains in a range and no doubt the move in Equities will come as we reach a resolution with the Debt Ceiling. I am amazed at how resilient (or complacent) the market is currently despite this genuine potential threat. I have always been of the belief that a market that shrugs off bearish news is indicative of a strong underlying trend. We will see.

Looking at the S&P 500 index, the market appears in a short term consolidation pattern. 1330/1228 is key short term support and as long as this holds, look for short term breakout trades for a retest of the highs.

S&P 500 Cash 15mins:


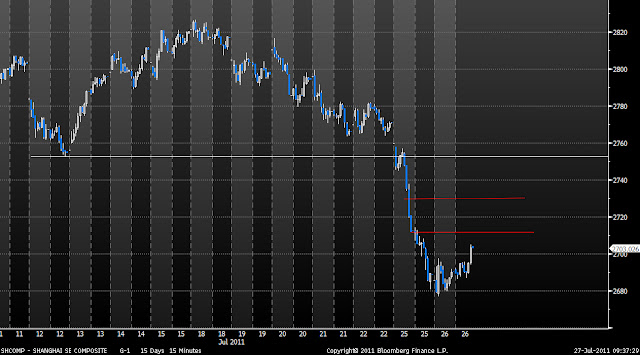
In Australia today, the SPI futures are indicated at 4520 right back down to yesterdays lows. I really do not have a clear pattern or setup currently. In situations like this, I like to trade the levels and keep it really nimble for scalps only. I am looking at 4505/4500 as support and 4540 as resistance. I will have my eyes firmly on the Shanghai Composite when it opens today. Given the strong breakdown the other day and new momentum low, the highest probabilty trade is to short the first bounce looking for a retest of the low. 2715 and 2730 look like potential resistance areas today.

Shanghai Comp 15mins:


Bigger picture there are a number of markets now "testing" their previous highs whilst other still lag which is setting up all kinds of divergences and dislocations. AUD is now testing 1.10, the Nasdaq 2415/2420 and Copper is on its way to test its previous highs. Possible double tops? Note S&P 500 still remains some 20points off its high whilst all Asian indices are well off their highs with some breaking out of consolidation patterns whilst others such as Australia languish. Not an overall healthy picture to me.

Austin

Tuesday 26 July 2011

A Mixed Story


The technical picture across Asia is a mixed one indeed. My main fear yesterday coming into the session was China's inability to rally despite the positive leads from the US. When the 2750 level broke early, we saw a very strong trend day lower. This market is in a very pecarious postion indeed. How long before this has a genuine effect on the rest of Asia and maybe even the globe?

No doubt we are in a tough summer trading environment. I thought the best thing to do at this point was to break the Asian region up into the Bulls and into the Bears. At some point I imgaine all these markets will align so be prepared for false breakouts etc
BULLS

Singapore Daily:
As can be seen, the market has broken out of a big consolidation pattern. Yesterday saw a test of the breakout line on a weak day, but the market held in positively. Look for breaks of 3180 for a genuine move higher.


India Daily:
On the cusp of a major breakout? The market has been coiling up under this overhead resistance level and expect a range expansion imminently either way. Note the influence the 200SMA has had on this index.


BEARS

China Daily:
The recent rally has run out of steam. Yesterday was a strong bearish trend day and I would expect continuation at a minimum. If the recent June low at 2600 breaks, we are in trouble.


The Longer term daily chart shows the broad consolidation pattern. Some weeks back I stated that the false break of the low end of the trendline was a great bear trap and failed pattern. If this low subsequently breaks, expect a very strong move lower indeed. Are we looking at a sharp C wave move lower?


NO MANS LAND

Australia:
We have a tradeable low in place at 4450 in the XJO. However, ever rally gets quickly slapped down. Look for breakout confirmation above 4600 and I remain positive as long as we hold 4500.


No doubt the resolution of the debt ceiling debacle will give this market the catalyst it needs. My take on the S&P 500 is that it is trading at the top end of its range. Thus, this remains a fade vs 1345/1350 and look for breakout trades above.

S&P 500 Daily:

Thanks
Austin

Monday 25 July 2011

Update

Good Morning All

I apologise for my lack of updates of late, but I have recently taken on a new trading role at a major IB in Australia. This is a huge opportunity for me and is indicative of all the hard work I have put into my trading and this site. I have every intention of keeping the blog going and will continue to post regularly now that I am setup and settled. Please keep all the comments and questions coming.

I will post some charts later today but here are a few of my thoughts coming into today:

-S&P futures have gapped down 10pts to 1330 as I write. The market continues to struggle at the top end of the range i.e. 1340 to 1345. The Nasdaq is also "testing" and failing at previous highs. Key short term support is 1315 to 1320 for the eminis.

-The S&P needs to hold in today/Tuesday to keep this rally intact. This market is still in a broad range thus trading the range is key until a clear signal comes highlighting a range expansion.

-SPI futures gap strategy will be in play today. I am looking for support at 4560 and then all the way down to 4530. Strong resistance at 4585/4590. Today will be a volatile one I believe but remember to buy support first, and then short if it drops when day trading.

-Bigger picture, the XJO has put in a solid double bottom pattern off the 4450 support level. Look for pullbacks to 4530/4555 for a possible retracement long trade. Any break of 4450 in the coming weeks is bearish indeed.

-China continues to buck US overnight leads. Despite the recent surge in Eurostoxx and Eminis, China has actually fallen from 2830 to 2770 over the last 5 days. This is NOT good and the also time I saw this decoupling in the Shanghai Comp was at the recent April high before the big sell off. 2750 is key short term support and this needs to hold

-Currencies are showing some interesting divergences. AUD broke out of the consolidation pattern I highlighted some weeks back and is now "testing" 1.10. I am looking for a possible bearish reversal out of here. EUR is still rangebound and 1.45 is key short term res.

Thanks
Austin

Friday 8 July 2011

Where To Now?

Morning All,

It is a beautiful Friday in Sydney, the surf is pumping, and we are looking at a nice gap up on the open. Tough to not like that. My gap strategy is firmly in play today and the basic outline of what I mean by this can be read at this post: http://swingtradersedge.blogspot.com/2011/05/day-trading-gaps.html. We are looking at a wide morning range of 4605 to 4625 thus trade the levels until a clear break either way.

The S&P 500 broke out from the recent 2 day range and surged beyond my 1340/1345 fade zone. I was looking for some kind of bearish reversal candle out of this level if we were to continue to follow the 2007 scenario, but it was not to be. Thus, we move on and focus on this trend once more which is clearly up. This market is going higher. However, will this be the final hoorah? I think so but that's not tradeable for now. I try to be flexible and nimble throughout my trading and I do believe it is the key to success.

S&P 500 Daily:
Looking like 1370 is the next obvious target for the S&P 500.


S&P 500 Weekly targets:
1370 was looking like an interesting top right at the previous 07 support level and 76.4 retracement. Should we break through these levels in the ensuing days, the other possible targets are the 78.6 retracement at 1380 and then a previous pivot high right up at 1430/40. One step at a time though.


S&P500 Breakouts
I showed a similar chart a few days ago and thought now was an opportune time to update. Markets go through periods of contraction and expansion. Corrective moves lead to bases patterns and "tests", and the subsequent breakout from these patterns lead to new trends once more. The chart below shows the interplay between these corrective patterns and new impulsive trends throughout this bull market. Note how these trends have a habit of lasting for longer than deemed imaginable. Of course there are going to be setbacks and areas to fade along the way. However, focusing on short term consolidation patterns and retracements back into the trend is now the course of play until we see a clear Climax pattern or exhaustion.


I do think that there are enough patterns across markets to suggest an important high and turning point for markets as we approach the end of the summer. Some food for thought:

52 New week highs:
Despite US indices moving higher, new 52 week highs continue to diverge. These are the kind of divergences I look for at major market turning points.


NYSE Advancing Volume:
Similarly, the advancing volume continues to dwindle as the market moves higher. This is not indicative of broad investor buying and risk appetite. This is not the strongest part of the trend but a bull market in its final stages. Another factor to bear in mind.


Crude Oil Daily:
Looks like a broad topping pattern to me, similar to what happened at the last major market turn. Looking for this recent bounce to make a strong bearish reversal to confirm a tradeable turning point.


Crude Oil 2008 Daily:
The first break of the Head and Shoulders pattern was a "trap". The subsequent retest and failure at the neckline sealed the fate of this market. Looks similar to now?


USD Index Daily:
The USD seems to be tracing out a broad triangle which is in line with my AUD and EUR charts that I have been showing. It is hard to imagine a Equities top without a solid USD low. I think it is very possible that we will see a breakdown of this triangle and a retest of the May lows which would be a great area for a trend reversal i.e. to up. Note the very bullish divergences on the momentum indicator and also note that triangles often occur in positions prior to the final movement in the direction of the larger trend. In Elliott speak as 4th waves or B waves. After a triangle pattern is complete, the final move is often swift and short affairs.

Speaking of triangles, I have shown a lot of consolidation patterns throughout Asia that are now breaking to the upside. Is it possible we will see breakouts from these patterns that fail to reach new highs whist the US markets make new highs setting up all kind of divergences? A likely scenario to me.

Strait Times Index

And to Australia, I continue to believe that there is a great opportunity to get out of this market and even position on the short side in the coming weeks:  http://swingtradersedge.blogspot.com/2011/06/topping-pattern-anyone.html


Thus in sum, overseas indices continue to steam roll ahead and there are some good breakout patterns appearing in Asia. I believe this rally still has some legs to it. However, there is certainly enough out there to warrant caution in the bigger picture. There will always be bad news and setbacks. Hedging as we move higher will be a great play in these final throws.

Austin

Tuesday 5 July 2011

Asian Market Update

I thought I would run through some Daily charts of the major Asian Indices and update the technical picture since my last major post: http://swingtradersedge.blogspot.com/2011/06/why-i-still-like-asia.html. That post proved timely indeed and we have seen a pretty strong thrust higher. The power of failed technical patterns hey! I do believe we have higher to go still but it looks like it may be time to take a bit off the table in the short term.

I love the simplicity and effectiveness of Daily charts. They really do offer such a clean overview of price action and the battles won on a day to day basis. Regardless of whether you are a short term intraday trader or monitoring longer-term positions, much preparation must be done when the markets are closed and Daily charts should be that starting point.

Shanghai Composite Daily:
A great double bottom trade and bear trap on the close back above 2650. I think the short term target for this index is 2850 to 2900 and then we see. A great illustration of the amount of money that can be made by looking for "test" trades and low risk turns.

Hang Seng Daily:
The breakout trade above the 22k level proved to be a great one. With a gap up like this right into the 38.2 fib retracement, you just have to take some off the table. Short term I think 22,900 to 23,000 will prove good resistance. Ultimately, this could advance right back up to the top end of the channel but that is some way off yet.


India BSE 30 Daily:
This market has surged off the double bottom trade right into overhead resistance. The trade now is to take some off the table and look for either i)short term scalp shorts vs this downward trendline ii) the bigger picture breakout trade

Nikkei Daily:
Successful breakout right into the 10k target. I would be out of this market here and possibly even looking for double top short

Strait Times Daily:
Great bounce out of the upward trendline and breakout trade. Price is now rallying right into the overhead downward trendline. Similar to India here.

ASX200 Daily:
And finally to Australia. This is the laggard of the region and I believe it will remain this way for the foreseeable future. High rates and a high dollar do not lend themselves to overseas flows which are integral to getting a market really juicing. Furthermore, we have an inept government who do everything in their power to worsen our economic fortunes (rant over). Anyway, I still think this market has higher to rally but it will be stop and start as I have been stressing. Still looking for 4700 to 4750 and then we will see.


In sum, bulls should be tightening up risk as we move into the cited res zones. I find the best swing trades last for a period of 7 to 10 days and it has been a great run out of all these failed technical patterns and double bottoms.

Thanks
Austin

Monday 4 July 2011

Is This A Fade?

The rally overseas has run right into my target zone. And then some. It always amazes me how the market can go from one extreme to the other in such a short space of time. Time to switch off the guns from one of my posts only a few days ago: http://swingtradersedge.blogspot.com/2011/06/switching-to-guns.html.

As traders this is what we crave but you just have to be willing to develop that low risk idea and understand the nature of the market. The best time to be short is never after a protracted decline off a new market high. In fact, there is only a really a short window of opportunity to really make money from being short equities ever, especially in this bull market. This is the reality how the equity market operates and the reality of a 0% interest rate environment.

Much as I was looking to buy in the low end of the range, I would be looking for low risk short opportunities at the top end of the range. This is a short term trade only for now given this is a fade trade vs a new trending up move. The market is going to do a few things here: it may continue to move higher and advance towards the previous high at 1370; more likely there may be a brief "pause" and retracement back to 1320/1315 before the highs can be reached; or the market will fail spectacularly and trap all the bulls leading to a genuine market top and lower high. Obviously I don't know which scenario the market will follow but in 2 out of 3 of those scenarios mentioned, I make money by shorting here. Makes sense to me to short first with tight stops, and join once more if the rally is the real deal.

S&P 500 Daily:
This is my target zone. I like 1340 to 1345 as short levels. This is the 76.4 fibonacci retrace, the high of the previous breakdown candle, and strong overhead resistance. A high here would make for a nice Head and Shoulders pattern indeed.


Once more to illustrate what happened at the high in Oct 2007. The market broke out of an ending wedge pattern but ultimately ran out of steam right at the 61.8 to 76.4 fib target zone. That huge bearish reversal candle set the stage for a real panic sell off. If we are to continue to follow this parallel, look for similar confirmation and it has to happen NOW.

S&P Daily Oct 2007:


Given it is a public holiday in US, it will be interesting to see if anything comes out of European trading tonight. Asia has been relatively lacklustre today and I will put up a more meaningful post after todays close.

Austin

Friday 1 July 2011

Targets For The Rally

Morning All

What a week. I wake up this morning to see the S&P 500 another 1% higher right into my 1320/1330 target zone and fulfilling my projection that I called for on the 22nd June: http://swingtradersedge.blogspot.com/2011/06/yup-that-was-it.html

I am sure there are many bears out there who are confounded. However,  anyone who has been reading this blog consistently would have nailed this move. This is not to gloat as no one likes those services. However, I genuinely believe that you will find very few blogs offering the depth and accuracy of analysis provided here. My intention here is to try and get readers to look back over recent posts and understand not just the setups, but the thinking patterns required to be a success in this business. I guess there is no better avenue for marketing then putting your analysis out there and getting it right. This also means that I am probably letting my emotions get way ahead of me so I am probably good for a fade :)

Here are some recent posts of interest:
22nd June:http://swingtradersedge.blogspot.com/2011/06/yup-that-was-it.html
24th June:http://swingtradersedge.blogspot.com/2011/06/hammer-time.html
27th June:http://swingtradersedge.blogspot.com/2011/06/why-i-still-like-asia.html


So where to from here? As a swing trader, I take profits in the direction of the price move or just as price reverses via a trailing stop. Swing trading depends NOT on riding out the reactions or giving up profits already won like Trend following. Thus, right here I wold be tightening up risk considerably and letting the market take me out. If you caught this move successfully you should now be on short term look out to lock it in.

S&P 500 Daily:
My target zone for the S&P 500 was from 1320 to 1330 and this is illustrated below. We have the 61.8 Fibonacci retracement coming in this zone and I have always found this a key reversal point. Note we also have a strong confluence of resistance at 1340 which is the 76.4 retrace and overhead horizontal resistance. Obviously I have no idea where this rally will halt thus letting the market take you out or trailing a stop is key. I would wait for a strong bearish reversal as confirmation before looking to short


S&P 500 2007 Top:
I have been following an interesting parallel with the 2007 topping pattern and this continues to play out to a tee: http://swingtradersedge.blogspot.com/2011/06/party-like-its-2007.html. Note that in 2007 we reversed right out of the 61.8 retrace with a very strong bearish candle reversal. Look for something similar if this scenario and parallel is to continue to play out. I think it just might but let the market prove it first.


And now.....
2011


I would still give this rally a bit more time before getting bearish. However, just as we had to be willing to buy it when no one wanted it 2 weeks back, be on guard to sell it when everyone wants it. I do think there is a strong possibility the high for the market is in so you will want to be on guard. If this is going to follow the 2007 pattern, look out below

XJO Daily:
Yesterdays breakout confirmed a short term trend change. I envision that the rally out of this low will be stop and start with many back and forth moves. Ultimately, 4700 to 4750 looks like an interesting resistance area. The rally is still in its infancy so give it a bit of time before getting too bearish.


EURUSD Daily:
Broken out from one minor trendline and looking for a larger breakout to "test" 1.50. Any failure to break the 1.50 high would seal a meaningful high to me

AUDUSD Daily:
Still think price has more to do on this breakout and I am looking for 1.08/1.085 at a minimum. Ultimately, a test and failure of 1.10 would be ideal to confirm a more meaningful top and shorting area.


Thanks for all the comments and messages on the blog of late. I value all the interaction and the feedback so pls keep it coming. I hope you are enjoying my commentary and using it to the best of your abilities.

Thanks
Austin