

On the twitter feed yesterday, there seemed to be A LOT of panic and all the charts that were posted were forecasting huge breakdowns, iii of 3 downs, crash etc. I picked up on particular comment where an astute trader said "IMO everything is looking cataclysmic to me". Now I am not trying to be a hero as picking a bottom is fraught with danger and some of these points raised were very valid. However, the important thing to gauge from this is that in these situations, it is very very likely that the crowd and the market will be FEELING exactly the same. Everybody is looking at the same charts and the collective social mood will be wrapped up in this bearish mentality. This is the worst time to trade. In fact, these are the exact moments when you have to be prepared to do the uncomfortable and fade the crowd. Sure enough there was quite a sharp snap back last night. I believe there is a genuine possibility of a bear squeeze to come.
No doubt I tried to call on a turn on the 16th May and this was short lived: http://swingtradersedge.blogspot.com/2011/05/turning-point.html. However, by identifying low risk opportunities with the correct stops, no damage is or was done.
The S&P Emini futures did break the wedge type pattern I posted yesterday during Asian hours. However, there was a very strong recovery and the downward trendline was recaptured. This is indicative of a solid bear trap. Note also that there are Fibonacci relationships in place between the waves that indicate the end of this corrective pattern. More confirmation is needed but I like this as a low risk trading opportunity. That is what we do as swing traders- keep identifying low risk areas to get into the trend. We never know which one will play out but the winners will far outweigh these small loses as long as you are obeying the stops.
Emini S&P 60mins:

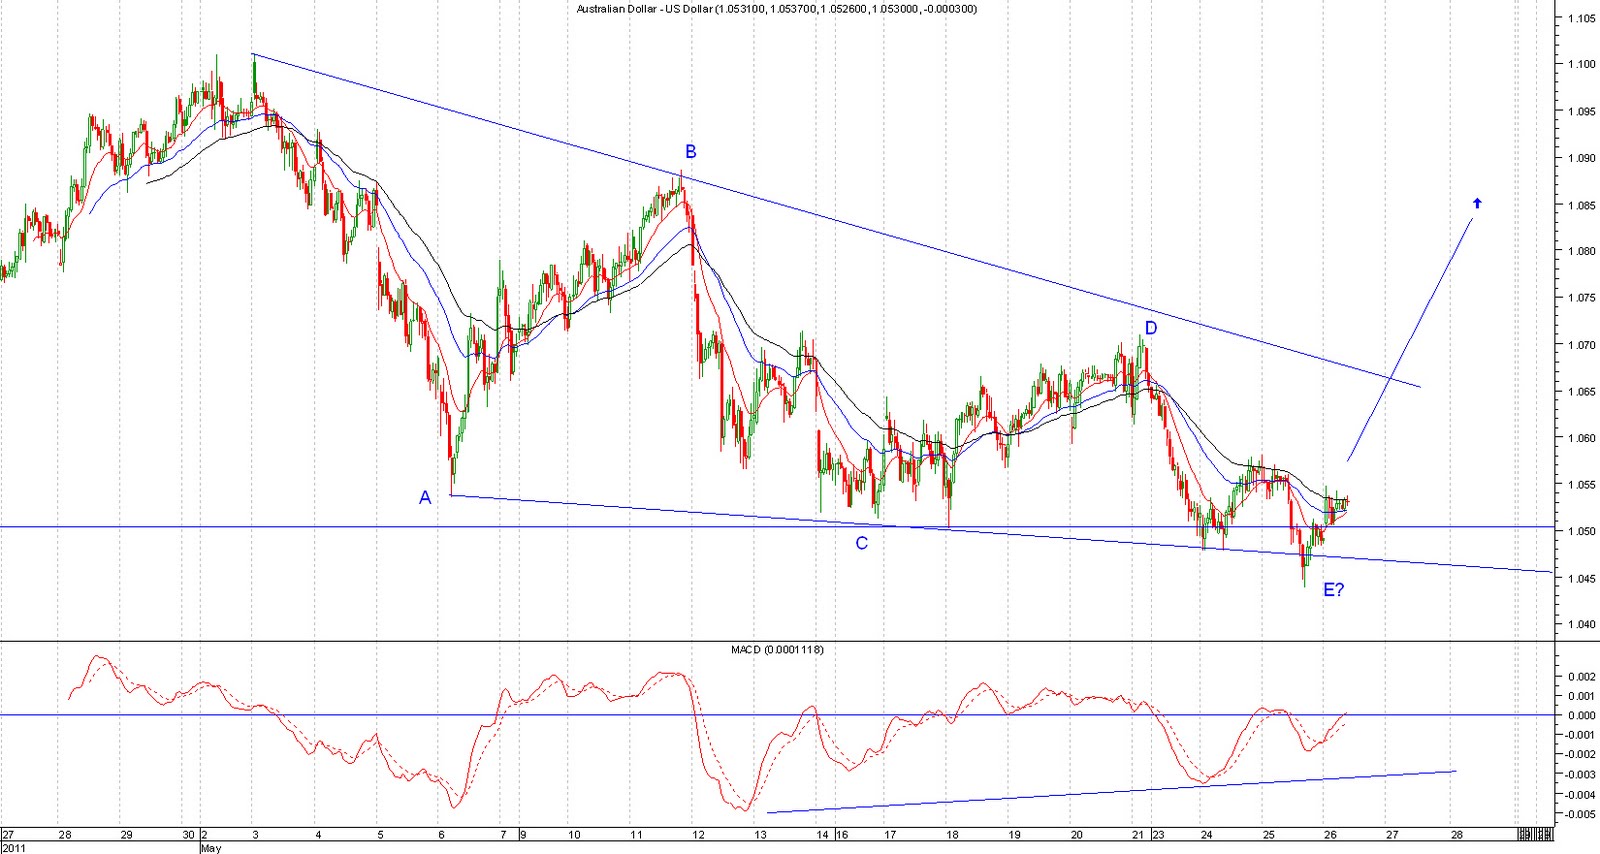
Interestingly, AUD also manged to recapture the downward sloping trendline I had in place. This could be irregular type triangle or a wedge pattern. No matter, we now have a failed breakdown, a bullish inital price reversal, momentum divergences in place and a clear corrective pattern. Low risk entry here or wait for price to clear the downward trendline.
AUDUSD 60mins:
I thought I would quickly show the Australian Sector indices as they are coming into some very interesting areas of support.
Materials Sector Daily:
2 Signifcant trendlines coming in here

Materials Sector Daily Zoomed in:

Financials Sector Daily:
This sector does look rather weak with a lower high in place and a strong thrust lower. However, we are now approaching the low end of the range and a 61.8 fib retracement. Time for a pause and possibly look to buy oversold names on confirmation for a short term swing only.

Energy Sector Daily:

ASX200 Cash Daily:
I find this chart very interesting indeed. Firstly, the market is approaching an upward sloping trendline and natural area of support/the low end of the range. This is not the time to be initiating new shorts Furthermore, I have overlaid some simple bollinger bands over the price action (2 Standard Deviations). As you can see, when price closes or trades sharply out of the lower end of the bands, there is a strong buy signal once price closes back into the band. This represents panic as the market loses its head and the rubber band snapsback. We are approaching a similar juncture.

Certainly, this kind of market action across asset classes calls for ALL traders to be incredibly nimble and careful. Don't get married to a position for too long. However, I do believe we are seeing an emotional extreme in the market place which offers yet another great risk/reward buying opportunity. Some markets look quite horrible (most notably China) thus I am certainly not forecasting a strong impulsive move back up to the highs yet. However, being a trader is all about identifying low risk/high reward setups. This is another one of those opportunities soon I believe.
Thanks
Austin