

I just wanted to continue on the recent theme I have been drumming home here- I continue to see underlying weakness across markets. CDS prices in Europe continue to make new wides. France, Spain and Italy all made new all time highs last night. Yields on sovereign debt continue to blow out. This despite new heads of state being installed and a Trillion EUR pledged bailout. I don't know what positive catalysts there are still to come but clearly the markets are not paying attention. The US "Super" Committee is also due to release plans to slash $1.2trillion in debt and expect increasing nervousness ahead of this and mumblings of more downgrades if they cant get their act together. I don't have too much faith in them. Most importantly, the technicals are not healthy here and abroad.
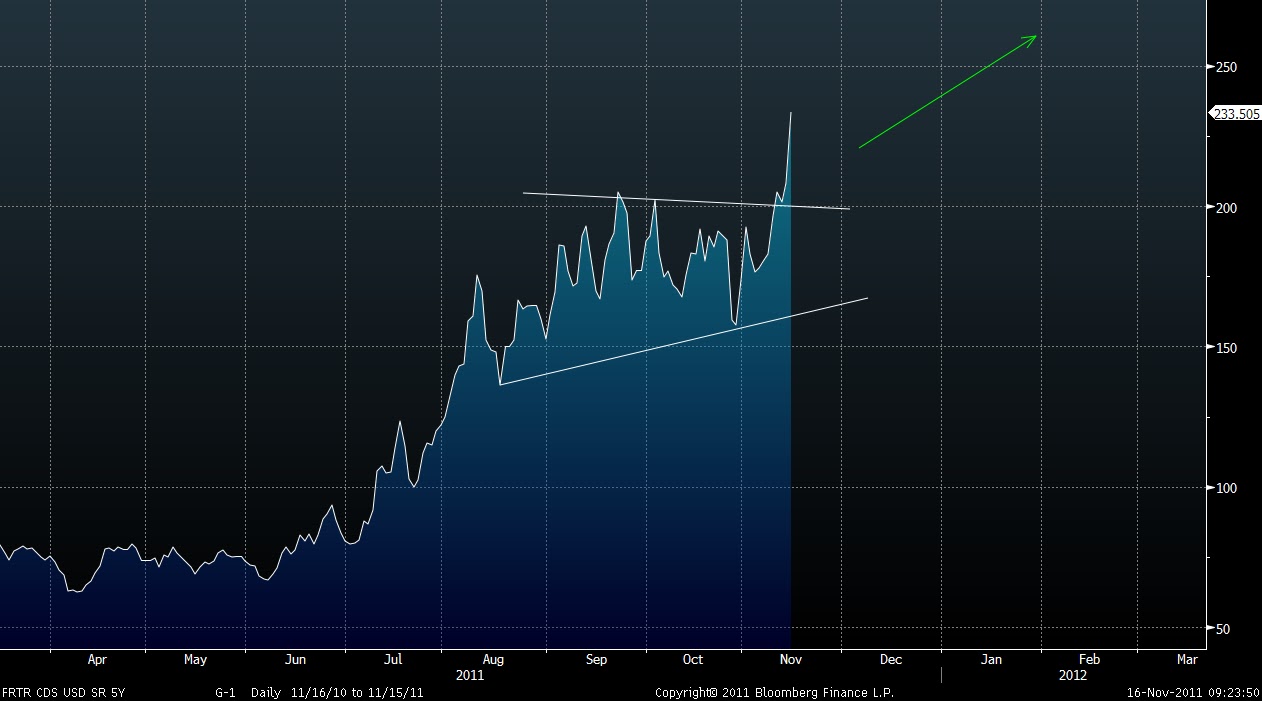
France CDS Daily
Breakout to new highs. 2nd biggest economy in the region. All looks healthy here............
I showed a number of bearish patterns in overseas markets in my last few posts: http://swingtradersedge.blogspot.com/2011/11/monday-musings.html
http://swingtradersedge.blogspot.com/2011/11/i-am-bearish-take-2.html
Monday I talked about selling the Emini S&P500 at 1265/1270 looking for mid 40s. This worked out well. That market is obviously in some kind of triangle pattern and volume has continued to dwindle throughout the pattern. We await the breakout either way but I just don't think it will be an upside breakout. The DAX is also flirting with that neckline.
However, I wanted to focus on this post on some confirming evidence here in Asia.
BHP Daily:
The recent stalling action is all indicative of a Wave 4 type pattern. I have labelled a very valid count here. Note the strong bearish reversal candle at $40 and the minor 4 of lesser degree. The bigger picture trend is down and the recent short term rally has run well out of steam. A break of that trendline should initiate a move down into the previous lows and beyond.

RIO Daily:
A Similar count. Note the continued failure to break above $70. This stock is clearly offered. Looking for a breakdown in coming days.

CBA Daily:
Another big component of the Index. The Banks have been major outperformers vs the miners. Nonetheless, CBA tagged the 61.8 retrace and the 200ma and reversed. Up here, it is a low risk short for a move back to $46. I could see Miners making a new low whereas banks make a higher low in time.

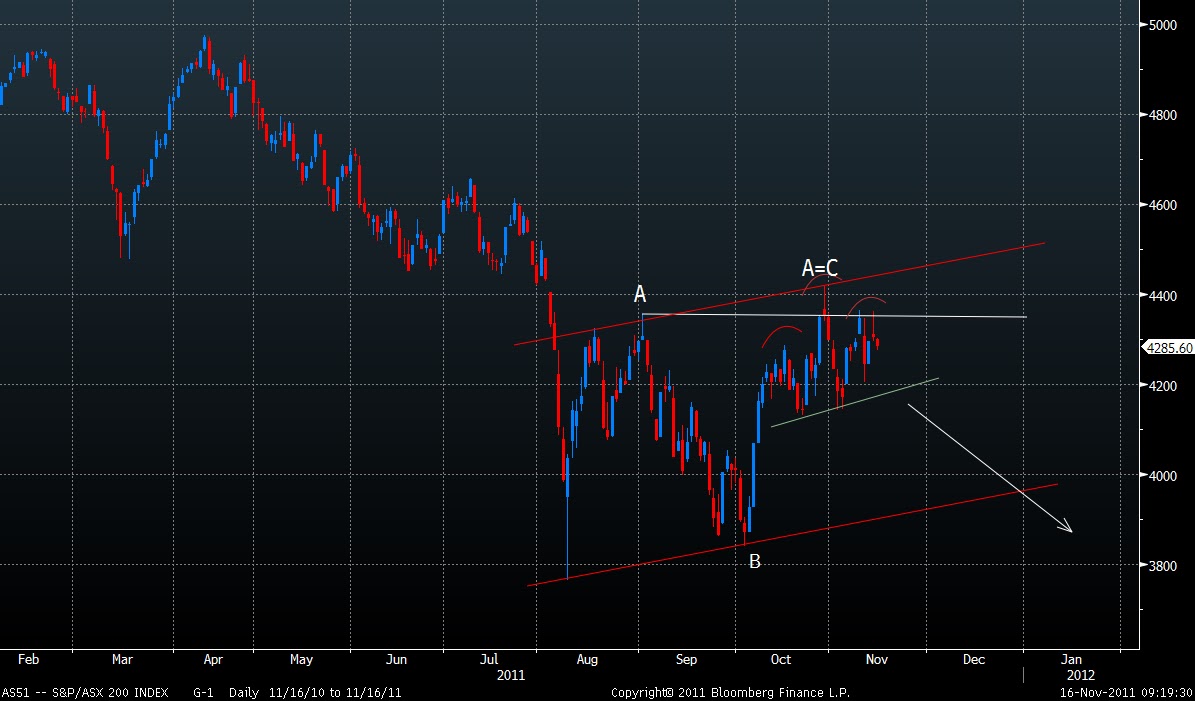
ASX200 Daily:
The best risk reward trade here remains selling/shorting up here with stops above 4400. We have a perfect A=C move off the low. We have price reversing off previous highs and at the top end of the channel. We also have a potential short term head and shoulders pattern forming. Any move below 4200 in coming days would trigger this.
AUDUSD 5 days:
The barometer for risk. A market that breaks out from a base pattern and retraces all of its gains and more is not healthy. As per my last post, we have a bigger picture Head and Shoulders pattern in play.

So all in all I remain nervous. The patterns, the fundamentals and the tape are all indicative of a tiring market rally. Perhaps we do breakout to the upside in the S&P500 and I will be forced to join for a trade only. However, I view a BREAKDOWN as more likely.
Thanks
Austin
P.S
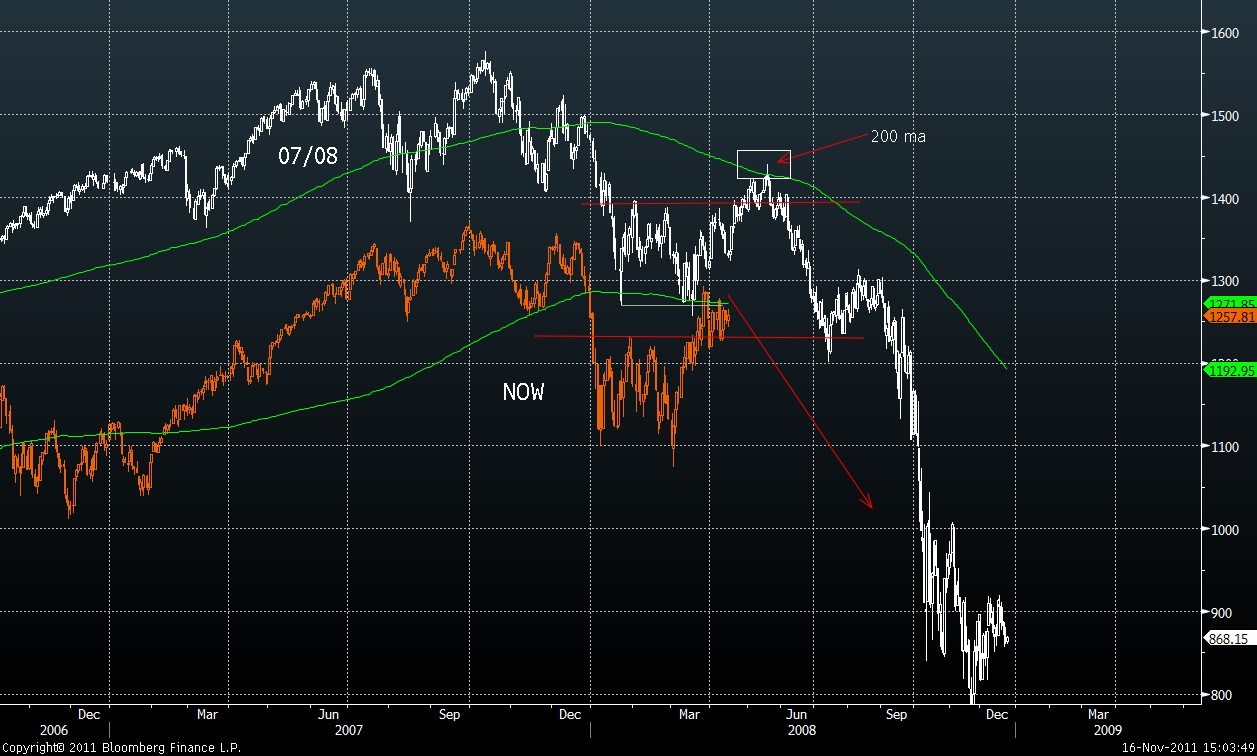
Havent shown it for a while. That 200 day capped the rally in 08. Done the same again this time. Hold onto your seatbelts
P.P.S
(UPDATE)
ASX200 Intraday
Opens +0.4%, Closes -1.5% on lows. Nuff said
