Morning All,
I will keep this post relatively tight this morning as I had a rather late one last night trading the S&P500 Eminis. During European trade, the Eminis grinded lower and lower, and it looked set for a breakdown. However, I know from experience that these "tests" and breakdowns through support the first time round are often fakes. There were a number of patterns across markets that looked like corrective ABC patterns rather than new impulsive moves lower. I put this on twitter late in the evening:
"$ES_F: so does this thing crack or hold the neckline here at 1300s? I just have to buy support first despite being sooooo bearish"
I did buy the low 1300s with stops at 1295 and got v.v. lucky indeed. Sure enough, the market broke through 1300 only to trap the bears and a resulting strong squueze ensued. The S&P500 cash market gapped down, made a low in the first 15mins, then rallied all day. Encouraging price action indeed.
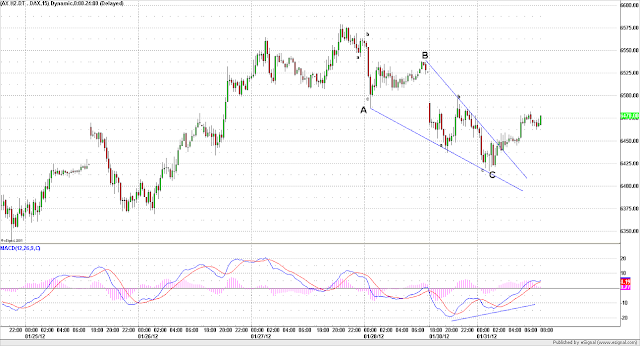
Here are some of the corrective patterns I was monitoring. Bullish divergences and an underlying higher time frame uptrend form important backdrops to these trades.
Emini S&P500 15mins:
Emini Nasdaq 100 15mins:
DAX Futures 15mins:
So where does this leave us? I wrote yesterday on the blog:
"Tuesdays are often my trend reversal days. Its possible that we may see a move back up to retest the 1333 S&P500 cash highs on Monday/early Tuesday, and this would provide a great low risk short entry. I personally will scale in at 1320 and then more up at the previous highs."I think last nights strong bullish reversal is all part of this move to "retest" that 1333 high (cash). I will be getting out of my longs into 1310-1315 and looking for shorts in 1320s. Use your fib retracements, res levels, candle reversals- whatever it is you use.
Is it now possible that we are looking at the right shoulder of a Head and Shoulders pattern playing out? A lot of bears will be cleaned out and discouraged given yesterday, which makes it an ideal backdrop.
Emini S&P500 60mins:
In Australia, despite the overnight volatile range, we are indicated at 4238 which puts us right back into yesterdays range. Sometimes it is best to keep things simple and the cash chart below shows our market coming back into decent supports in the 4250-4260 zone (cash). Thus, I will be looking for buy setups today as a short term trade for a potential retest of Fridays highs in coming days.
XJO 15mins:
My SPI range today: 4222 to 4260. Outlier levels 4285 and 4210.
My SPI plan today: I will look to buy yesterdays low at 4230/4231 with tight stops and also look at the low 20s for another long entry. We may be under a bit of pressure early due to this (thanks Hipchat community): http://www.heraldsun.com.au/business/big-banks-on-notice-over-downgrade/story-fn7j19iv-1226257735392. The short term trend is still down so these long entries should be tight until we see more confirmation. I will look to cover any longs up at 4260 and will scalp short up there should I see price action tiring.


