Wednesday, 26 October 2011

Short Term High Is In

Morning All,

I love Fibonacci. Last night the S&P500 futures topped out perfectly at 1254, right on the 61.8 fib retracement from the May high to the recent lows. Remember the panic low that occurred at 1102 on the 38.2 Fibonacci retracement? It was posted here ahead of time. I really hope that the charts shown here illustrate how powerful this stuff really is.

I believe there is enough evidence out there to call a short term high in place. I have been calling for a intermediate rally for some time now and this has been a great call: http://swingtradersedge.blogspot.com/2011/10/double-bottom-take-2.html AND http://swingtradersedge.blogspot.com/2011/09/intermeadiate-low-is-in.html

However, we have got to my targets in the S&P500 and DAX very quickly indeed, much faster than I had anticipated. Thus, I don't think this market has had enough "time" to call the bigger top in place but from a trading perspective, price is now ripe for the first major pullback since the October low was formed.

Firstly, the S&P500 has put in a bearish reversal candle right out of resistance and the 61.8. This is ideal confirmation for a Daily high. I think the pulback will be choppy and am looking for a move down to 1150-1175 in the coming weeks. Great risk/reward Short.

SPX Daily:
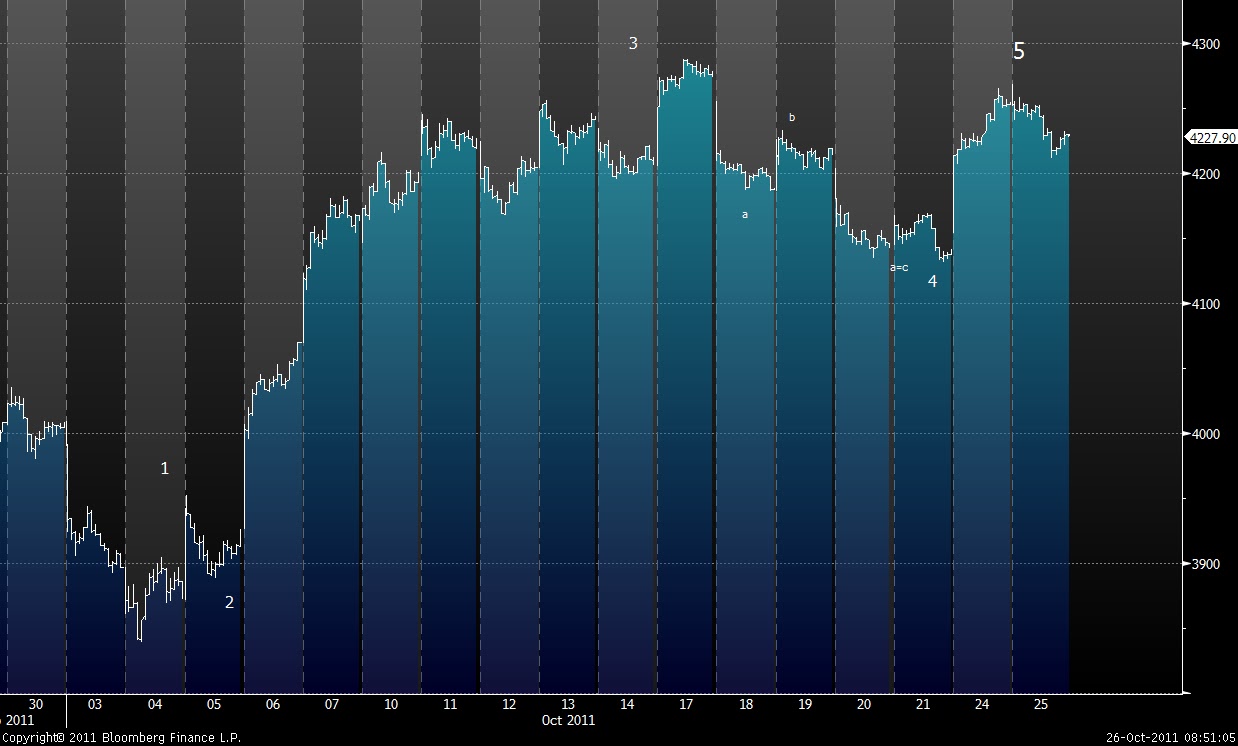
It was interesting that yesterdays trading in Australia was the precursor to the global sell off. Despite a 1.5% positive overnight lead, our market gapped up and made its high in the first minute, and then sold off for the rest of the day closing -0.6%. Once again, Australia was a lead market for global equities.


I see a number of complete 5 wave advances across Equity markets. The rally is done or has a squeaker new high to be made.

ASX200:
Hang Seng:

DAX:

S&P500:


In all these markets, there are strong bearish momentum divergences and waning breadth indicating a tiring trend.

I also found it very interesting that the DOW topped out last night right at the 200day moving average (not shown). This is exactly what occurred in 2008. The market continues to follow my parallel and pls see below. However, this rally has been a lot sharper and quicker, and I do think we need more time before the bigger picture high is in. The S&P500 200ma is still up at 1270 area and I think this will be hit later down the road (mid to late December).

S&P500 Parallel:


I should also note that the bearish sentiment extremes have been unwound. This recovery phase has resulted in key sentiment indicators such as the VIX and CBOE put/call ratio to move well away from bearish extremes. I am sure this also coincides with a huge unwind of record short positions. What is the path of least resistance now?

In sum, the rally off the October lows is in its late stages. There is enough Daily evidence to suggest a meaningful high for the next few weeks. The easiest part of this rebound is over. This is a traders market and use bounces over the next few days to position short vs stops above 1260. I think this is a monumental buy the rumour, sell the fact

Thanks
Austin

Monday, 17 October 2011

Do Currencies Have The Answer?

This week promises to be yet another big one for the markets. There are a whole host of companies reporting and we MAY even get something that doesn't resemble a rumour from European leaders although I suspect that is probably unlikely :). I thought I would take a break from my usual charts and show a number of Currency setups that look very interesting here from a short term perspective. FX is the biggest trading market in the world and no doubt this market proves to be a lead indicator for Equities, Bonds etc etc.

The Euro region is the heart of the crisis. EUR has had a strong run for the pat 2 weeks which seems to have buoyed all risk assets. Interestingly, I am now seeing a potential climatic Ending Diagonal pattern forming. These are great trading patterns that can be used with tight risk for turns in the market.

EUR 60mins:
Note the 3 wave push into overhead resistance with clear bearish divergences. This is a great area to be looking for a bearish turn. Use your own confirmation setups before putting this trade on.


EUR 15mins:
The Ending Diagonal/3 little Indians pattern can be seen more clearly here. This pattern was made notorious by Market Wizard, Linda Bradford Raschke.


AUDUSD Daily:
AUDUSD is also coming right into a confluence of res from 1.035 to 1.045. There is a downward sloping trendline, the 200 day moving average, and also a previous breakdown level. Also note the Fibs in the next chart. The bigger picture looks to be bullish no doubt but here we can expect a short term turn.

AUDUSD Daily ii:
This chart shows the Fibonacci Fan and the Fibonacci retracement- both also coming into the zone.

DXY Daily:
The USD is now retesting its prior breakout level and base pattern. Note the trend is up on the Daily and coming into the 55ema as well. This is a low risk short term buy trade with stops back into the base. Note this could be an ABC move off the low in the bigger picture. However, you just have to buy support here with this kind of setup.


These are all short term trades only. I see Equities right at the top end of their range namely 1225/1230 S&P500, 6000 DAX, 4250/4300 ASX200 etc. I have no desire to chase longs up here for now and instead will be looking to short early in the week with the right stops and confirmation out of these levels. Arnt we supposed to buy low and sell high?

One final thing. The Australian futures (SPI) have broken out of a clear consolidation pattern today but feels very lacklustre indeed. Could we be looking at a complete 5 wave move off the low now? Note the deep wave 2, the alt with 4, the bearish divergences coming into this breakout, and Wave 1=5 right at the 4300 level. Certainly I am getting nervous up here. Tuesdays are my reversal day and I will be looking for a high.

SPI Day Session 15mins:

Thanks
Austin

Friday, 14 October 2011

Asia Update

I thought I would quickly run through some Asian Daily charts of interest. I think there are many interesting intermediate bottom pattens in place. This should hold us in great stead for the run into Christmas. This fits in with my views of both US and European markets. Sure we are kicking the can down the road, but this is why I choose to trade and not be a fund manager!

Australia Daily:
We have seen a higher low form and a clean breakout from a flag type pattern. The candles thrusts out of this pattern are indicative of a major turning point and strong underlying momentum. Short term we have hit the first target at the 38.2 retrace and some stocks such as FMG, RIO and CBA are overextended. Bigger picture, the target is still right back up to 4500. Remember time is always important in forecasting a market move and we are but in the early stages of a new trend. Look for pullbacks next week.
Australia Daily 2010:
I find this chart interesting. After the panic move out of the high in 2010, we also saw a higher low and candle thrust pattern. This led to a strong rally for a few months into the 61.8 and beyond (although there were good pullbacks along the way).
Shanghai Weekly:
We have seen a strong reversal right out for the 61.8 fib level and previous swing low. The power of Fibonacci.


Shanghai Daily:
This chart shows a clear bullish candle reversal pattern (engulfing) with good bullish divergences in place. If we can break above this trendline, I think this will lead to a sustained rally in coming days. Don't fight a central government that is buying its own stocks.

Japan Daily:
This trade has worked out very well thus far. An ending wedge into support with bullish divergences in place. Still think this trade has a lot more legs to it.

Hang Seng Daily:
I got the initial support level very wrong in this one. However, when support drops, get short and look for the next level. This market put in a climatic low right on the 61.8 fib level. Still wondering if Fibonacci works? Interestingly, this looks like a clear 5 up pattern to me and a deep sharp pullback for a potential bigger picture Wave 2 low. This may still have some time to play out but we have a great low in place.

Wednesday, 12 October 2011

Thoughts

Well the World seems to be saved. Quite a turnaround hey? I am sure there are many commentators who are voicing how absurd this rally is. I am sure many a Hedge Fund manager is feeling truly beaten as they lift every offer in sight to cover shorts. The simple matter of the fact is, this is always how strong price moves begin. Markets bottom when they fail to penetrate previous lows. The headlines have changed and certainly the magnitude of events appear bigger this time, but the market continues to follow demonstrable patterns. It amazes me how much money is recklessly managed by some who really do not understand market cycles.

Time and time again I have talked about being prepared for a "Double bottom/Test" trade on this blog. Time and time over the past month I have stressed that the opportunity for being short for the big trade is NOT at this juncture. The recent rally has validated this and more. I look back on some of my posts and I am proud. Proud that I have learnt from my experiences. Proud that I was prepared to some degree for these events. I have not made nearly enough money (I am always happy to put my hand up) but certainly I have not been caught on the wrong side of this market. Sure I was bullish a tad early and wrong but that is the beauty of identifying the low risk/high reward trade and pursuing it. The real money is made at these turns.

To quote Paul Tudor Jones: "I develop a low risk idea on the market and pursue it from a low risk standpoint until I have been repeatedly been proven wrong or until I change my viewpoint". I love this. You just have to be willing to sell it when everyone wants it and buy it when no one wants it.

So here are some of my posts of late. This is not to gloat but it was and is my action plan. Pls read these:

http://swingtradersedge.blogspot.com/2011/08/my-experiences-in-2007.html

http://swingtradersedge.blogspot.com/2011_09_07_archive.html (this is probably my most accurate post ever)

http://swingtradersedge.blogspot.com/2011_09_12_archive.html

http://swingtradersedge.blogspot.com/2011_10_05_archive.html (the confirmation of the low)


Where to from here? Asia has bottomed no doubt for at least 2-3months. I will post a number of charts tomorrow. Short term many markets are overbought and now testing the top end of their range e.g. S&P1200/1210, DAX 6000, ASX 4250. I would not be surprised if we did see a short term pullback or consolidation. If u are a short term trader, you can fade away. Bigger picture, any big pullbacks need to be bought. This is the intermediate rally I have been calling for. This should last into the New Year (yup).  Sure our problems have not gone away and nothing has really been fixed. However, we are traders not fund managers.

Good luck out there. Focus on the uptrend

S&P500 Parallel Updated
Remains the greatest chart out there
Austin

Thursday, 6 October 2011

I Have Been Trading Like Sht

Good Evening,

Excuse my language but I have been Trading like sht! No need to hide it. No need to pretend I bought the recent low the low and am riding this market trend higher. I didn't.  Pure and simple, I have made some fundamental mistakes and thought this would be a good avenue to voice this.

As Traders, we live in a world of opportunity and also hindsight. We see movements everyday that may represent genuine opportunity or just random noise. Countless times I hear cries of "I knew that would happen" or "I told you XYZ would go up". I never understood these guys. What good does that do anyone? We deal with the now not then. In fact, I think these kind of statements are indicative of truly unprofessional traders who are not planned and who have no edge. I see traders like this at work everyday. The better approach is to ask what can I do to improve myself, why did I miss the setup and what does this mean for the next trade/market going forth?

My mistakes of late have been two fold:
i) Not taking a trading setup- S&P500 Double bottom trade (it was all written here prior)
ii) Not heeding the strength of the market when it was clear we were in a breakout mode- SPI futures above 4000.

These mistakes boiled down to lack of preparation, recent pressures at work (i.e. dont lose money) and frustration. I trade double bottom patterns the whole time but I didn't have an adequate enough entry signal for the S&P500 this time round. I knew the price I wanted to get long at, but I wanted to wait for confirmation given how dangerous things looked. Sure enough the confirmation came in the last hour of trade when I was on the way to work (the joys of the Australian timezone) and thus I missed it. The market kept moving higher and I didn't chase it despite knowing we had seen the low. My lesson- have orders in above the market which confirms the move! Have a defined entry for the particular trade setup. Go at your level or go after confirmation- either way have your orders in.

I took this frustration out today by shorting the market twice, albeit with tight stops, and missed the clear underlying strength. I am usually flexible but today I was blinded. A market that doesn't sell out of resistance is bullish. Sell resistance first and if it doesn't sell, join it.

So where does this leave us? To me this market has clearly put in a bottoming pattern/failed breakdown. Failed patterns are the best. The way we have recovered 1100 is indicative of the huge short base out there and the underlying strength at this juncture. The DAX made a higher low (which I have talked about forever) as has Australia. Bigger picture, we have a lot higher to run still. Thus the trades going forth should be quite simple: i) buy the first pullback into the 15mins/60mins timeframe trend OR ii) short term look to short a climatic reversal if this keeps going and gets overextended (1155/1160)- short term trade only.


That's my roadmap going forth. That's the new plan and my method for trying to get out of these bad habits. Everyday gives us a new opportunity to improve ourselves and make money. No one likes a hindsight trader. Learn from our mistakes, be planned, and go and make money.

Thanks
Austin

P.S. Some things to get out of a Trading rut:

i) Cut size down. The aim is to get the winning mentality back and not necessarily the finanacial reward.
ii) Focus on one trade at a time. Back to baby steps
iii) Go over trading plans/setups. I always find it helpful to recognise my best setups, my best trades and then wait for these. Stay planned.
iv) Relax. Sounds tough to do but it is important. Writing helps me get my anguish out and then I can rebuild. Go to gym, have a run, read a book, do whatever just relax that mind.
v) Visualise your success

Any others? Would be interested in what other traders do to alleviate trading slumps.


Wednesday, 5 October 2011

Double Bottom Take 2

Morning All

I will keep words brief and let the charts do the talking. Last night we saw a vicious squeeze into the close right out of the 1070/1075 previous lows on the Eminis. Looks like a classic false breakdown that brought the bears out and got them covering. This is exactly what occurred in March 2008 before the Intermediate rally began. See here for more details on this rally: http://swingtradersedge.blogspot.com/2011/09/moment-of-truth.html#0_undefined,0. Many will call this a 1 day wonder but you need to bear in mind the current market position- we are in a double bottom/false breakdown zone with heightened bearish sentiment. Last nights action tells you how jumpy this market is and it certainly doesnt seem to me that bears are in control if one headline can get the market ripping like this.

S&P500 Parallel Scenario
This chart says it all. We saw a double bottom/false breakdown in 2008 that led to a 60day countertrend rally. This has been and remains my primary view.


S&P500 Daily:
A good double bottom pattern and candle confirmation for swing traders.

Nasdaq 100 Daily:
Another good candle reversal pattern out of the low end of the range. A low risk entry below yesterdays lows.


Eminis 15mins:
Last week I talked about the importance of the 1140 level. This held on a few occasion but when support broke, a retest of the Eminis low was the play. This is what I mean when I say buy supports first, sell it when it drops.

AUDJPY:
This really is the barometer for the "risk" trade/carry trade. Price put in a interesting reversal candle right out of the low end of the range.

AUDJPY/AUSTRALIAN FUTURES
This chart shows the correlation between the Australian equity futures and the AUDJPY. As you can see, they are very tight. With AUDJPY bouncing out of clear support and with the ASX200 at the low end of the range, this could be a great time to put on that contrarian long trade with the correct stops.


I will have more later
COME ON THE BULLS
Austin

Thursday, 29 September 2011

The Moment Of Truth

Morning All,

The next 2 sessions really will define whether we are on the cusp of an intermediate rally or whether this market really is in trouble and destined to break lower. To me, it really is that simple. The market is waiting upon a vote out of Germany and no one knows what will happen. The market was certainly fearful last night but breadth readings did not hit any new bearish extremes. For me, I believe that the DAX market has bottomed based on the technical work I have been showing here. I also think there is a good chance we have seen double bottom pattern in US markets. If this scenario is to play out, the market must now hold in around here. Time to get your Fib retracements out and identify your low risk buy spots with tight stops.

I have been toying with the idea of an intermediate corrective rally as we saw in 07/08. I was somewhat early last week. However, as I keep saying, this kind of move should be choppy, whippy, and shake out both bulls and bears alike. This is what corrective rallies do. Yesterday I was studying this intermediate rally in 07/08 and this is shown in the chart below. How frustrating was that move? Ultimately, the market rallied 15% from low to high in 45 trading days right into the 200 Day moving average. It was only after this move that the market really sold off leading to the collapse in 08/09. This is how markets work. The initial move out of the high is never the best shorting opportunity.

S&P500 March 2008 Intermediate Rally
I have labelled a number of red arrows here to highlight the sharp moves lower within the overall higher intermediate trend. I think we may be looking at a similar scenario given the macro, given the concerns out there and the economic slowdown. This is obv dependant on the S&P holding its most recent lows.

S&P500 Current
I saved this chart yesterday before last nights sell off. I wish I had posted it yesterday! If we have seen a genuine double bottom, the market will hold in tonight. I envision the overall move being choppy and whippy for the unsuspecting.

In the short term, there are a number of good trading setups appearing.

Emini Dec Futures 15mins:
The Eminis built a great base pattern under 1140/1145 and we are now retesting this previous breakout level. This is a low risk long entry with stops below 1135. A great trading pattern (I just got long). If this cant hold then this is a genuine move lower back down to 1100 and lower.

Australian Dec Futures 15mins:
In Australia we are also looking at a great trading setup. The market has now pulled back to a previous breakout zone at 3980/4000. If this is a genuine base pattern (which I think it is), then last nights pullback offers a great low risk entry.

So in sum, we have seen some pullbacks to some great trading levels. If this market is going to hold in, it will do so here. The catalyst is coming tonight and thus obviously these patterns will be either quickly validated or blown away. So whats the trade? Buy it first (or wait for confirmation) and if markets do not hold, its time to flip and join this move lower. I don't know which scenario will play out but as a trader you have to be flexible. I do think there is a strong possibility of a bigger picture intermediate rally thus I am looking for buy setups.

Thanks
Austin'

Tuesday, 27 September 2011

Double Bottom Patterns

Good Afternoon,

In my last post I talked about the possibility of a Double bottom pattern playing out in the S&P500 and the DAX lows holding in. This occured yesterday with rumours circling of a Eurozone bailout deal in the pipeline. We will find out more in the upcoming days if these claims are substantiated. In the meanwhile, there are a number of bullish patterns forming across markets for the brave. The initial trade buying at the low end of the range has played out. It is too early to say whether a genuine low is in from the Daily charts but there are some good low risk/high reward trades.

S&P500 Daily:
Test of the previous lows and a strong reversal on Monday. Note that a higher low has formed whilst the DOW and Russell made new lows. This could be deemed a bullish divergence. The key 1140 level was recaptured last night. Very whippy and volatile but great opportunities for traders.
Dow Jones Industrials Daily:
Test of the lows and held. This is how new trends begin.
Russell 2000 Daily:
DAX 15mins:
A perfect double bottom trade off 5000. This is the heart of the crisis and if this market breaks out from here, this should really buoy markets.

Crude Daily:
Another double bottom pattern in Crude. Note the strong reversal candles off the previous lows.
In sum, there are a number of encouraging signs emerging after last weeks sell off. Price has held and reversed from the low end of the range. Also note that Copper has traded right into the 38.2 Fib retrace from 2011 highs to 2009 lows and held in. The ASX200 is putting in a strong day today, reversing all of yesterdays losses. A possible truncated low could be forming here but once again it is early days.

It all comes down to your timeframe. Traders who use the Daily charts should see these as encouraging signs and looking for follow through to confirm a more meaningful tradeable low. Shorter term traders would be looking to get out of longs as we are now back in the mid range.

Sentiment remains very bearish. Governments are thrashing out deals to stem the panic. I have no idea whether or not any deal will be passed- and that is why I use the technicals to guide me. I have consistently stressed that I don't think this is the area to be short for longer term swing traders. Sure I missed the sell off from the recent highs but I continue to believe that the best traders are willing to buy when no one wants it and willing to sell when everyone wants it.

Austin

p.s. This is the Emini Dec 5min chart I am looking at tonight. As long as price holds above this 1140/1150 area, I am looking to rebuy this market with the correct stops.

Friday, 23 September 2011

Thoughts

Well I was wrong. I really thought the market would hold in but this move lower has been stronger and deeper than anticipated. No doubt this is a new wave lower whether it is somekind of 5th wave or a bigger kick off move down. My line in the sand was 1140 and this was broken last night with relative ease on good volume. I guess overconfidence and my recent good run impacted my judgement. That's what stops are for.

The market will do 1 of two things here. Either the S&P500 will test the 1100 lows and hold in setting up a double bottom trade, or we break clean through that will lead to a strong drive down to 1040/1015. Obviously I don't know which setup will prevail in the coming days. I do know that panic situations like this always lead to very good opportunities for those who are planned. I also know that the market looked and felt just like this in 2008 and a double bottom was made in March 2008 leading to a very substantial rally. Fear now, just as it was then, has reached a fever pitch. Is it different this time? The parallel scenario I have been following is shown below.

I also believe that the DAX has put in a very good climatic bottoming pattern and thus should hold its recent lows. This is the heart of the crisis. Any continued rally should bouy global markets. We will soon find out.

S&P 500 Parallel Daily:


There are a number of mixed signals in Asia. The ASX200 is testing its August climatic lows but no new lows have been made yet whilst the Hang Seng has plummeted through support. Copper continues to breakdown and the A=C possibility is completely off the table. Its Friday and I doubt there are many willing buyers into the weekend with this market. The  S&P500 looks like it is overdone in the very short term and I would not be surprised to see it hold tonight with a small bit of short covering.

One final point. In these panic situations, Governments will do all they can to stem the bleeding. Sure it doesn't seem that anything is working currently. However, they will continue to drive a tank into this to try and rectify the situation. This leads to very squuezy markets so make sure you are in positions you can get out of.

Thanks
Austin

Thursday, 22 September 2011

Was That It?

A quick update here. The S&P got thumped last night post Ben's announcement and certainly the sell off looks strong with decent breath. Ulitmalty the market sold off at the top end of the range and I missed it. There was a potential warning sign with the S&P short term 1220 Double Top pattern and the Nasdaq bearish reversal out of the 200SMA on the Daily. A trading friend of mine at, http://marketletters.blogspot.com/ highlighted the underlying breadth weaknesses coming into that 1200 level and this has played out. I reduced the book somewhat into the announcement. However, where does this leave us now?

I called for an Intermeadiate corrective choppy rally up to 1250. These kind of moves, just like in 08, are overlapping and choppy and never move in a straight line. I still think this could possibly play out as long as the market can hold the 1160 level on a cash basis. The ultimate line in the sand is obviously the 1140 pivot and bears should look for breaks of this for confirmation of a new leg lower.

There are a few charts that give me small encouragement. Firstly, the DAX has been the leader since putting in its climatic bottoming pattern. The rally off the low looks impulsive to me and this could possibly be a natural retracement into good supports. I am looking for this level to hold.

DAX Futures 15mins:
The S&P 500 has now traded right into the 61.8 retracement off the last swing low. Certainly the extent of the sell off is very sharp but that is the way the market works these days with the increasing use of algos, electronic trading and stops etc.

S&P 15mins:

S&P500 Daily:
Back into the low end of the range and potential support. 1140 is the line in the sand.
Someone also asked about Copper on the comments field the otehr day. Interestingly, this has now traded right into an A=C support zone. If we see a bullish reversal candle here, that would confirm the pattern.

Copper Daily:

In sum, the markets are testing a number of key zones here. There is a lot of panic and these can be good buying opportunities. If this is a intermediate rally, the market must hold in pretty soon. There are a confluence of levels I am looking at namely AUD 1.00, EUR 1.35, S&P1160 (1155 dec futs), SPI 3965/3980. I will be looking to buy these levels today with tight stops.

Wednesday, 21 September 2011

It Is Asias Turn to Turn

Morning All

It has been a while since my last post. I guess I wanted the full impact of what I was trying to highlight filter through. Since then, we have seen a 7% rally in the S&P and a 10% rally in the DAX (the heart of the crisis): http://swingtradersedge.blogspot.com/2011/09/intermeadiate-low-is-in.html. However, Asia has not followed the script and has languished. It seems clear to me that Asia is waiting upon a major catalyst from overseas whether it is the Europeans sorting out their mess or Ben piling more dollars into the markets. Whatever it is, Asia is poised for a very strong rally I believe and we just have to be patient. I also continue to believe that the S&P and the DAX have higher to run. There is still a lot of bearishness around and yet the markets are clearly catching a bid despite the negative headlines. I am still yet to see a technician calling this market higher- the overwhelming consensus is that this is a bear flag/4th wave. Perhaps I am missing something, but my experiences tell me that the market has a habit of doing what everyone least expects. Bears will not be able to hold on for too much longer.

A quick run through of key Asian markets:

Hang Seng Daily:
This looks to be a great double bottom pattern to me. Clearly there has been a lot of volatility around this level and offers a clear low risk entry for the bulls. There is a good bullish divergence in the momentum indicators vs the underlying price action. Momentum precedes price.

Hang Seng Daily ii
Note that the market has hit a key pivot level. Once again, a great low risk long entry with the correct stops.

Nikkei Daily:
Price has traded right into support and the low end of the range. We have seen a breakout from a ending diagonal pattern with bullish divergences. The Japanese government is actively buying stock indicies/efts. Want to be short here? Don't be.


Australia Daily:
We have seen a strong thrust off the lows and a overlapping corrective pattern right into the 61.8 fib retracement at 4000. This is a great level for a higher low to form. A number of underlying stocks are at great support levels. Bottom line, I am looking for a breakout in the coming days targeting 4500.

Nifty Daily:
A perfect A=C on the low. A perfect failed breakdown. A great base pattern forming under res. Looking for breakout.


DAX Daily:
This pattern played out perfectly. Bigger picture, this still has higher to go up to the levels cited.


In sum, the market is awaiting what Ben can pull out of a hat. There is so much bearishness around that any big shift in policy will cause a monumental squeeze. The underlying price patterns and tape are indicating that there is genuine potential for a breakout. I will be reducing the book into the announcement but I have a bullish expectation of the outcome.

Thanks
Austin

Tuesday, 13 September 2011

Intermediate Low Is In

Good Afternoon All

(UPDATE) Asia is selling off and this is now completing all the Asian setups I showed here: http://swingtradersedge.blogspot.com/2011/09/getting-ready-for-swing-low.html. Everything is now coming together, just need that squueze event.

I thought I would put myself on the line today and call an intermediate low in place for US markets. Yesterday I put out a post looking for the bigger picture swing low and I think there is enough evidence out there to now confirm this. We did not get a clean double bottom pattern and certainly the rally off the low doesn't look impulsive. However, the S&P 500 has successfully defended the 1130/1140 zone on several occasions and held every time. The DAX has hit my 61.8 fib retrace and put in a small reversal candle. The Australian futures hit the key 4000 level and have rallied 80pts. The EUR hit my 1.35 level and rallied some 150pips. And most importantly, every single technician I read is bearish and I know that these are the kind of moments when one has to stand out.

The market continues to hold the 1130/1140 area despite the panic and fear in European markets. When a market continues to hold like this, it is sending a loud signal of underlying strength. One more strong session will lead to a breakout.

S&P500 15mins:
S&P 500 Daily Current:
A number of hammers have now formed at the low end of the range. This is the Daily confirmation I was waiting for.

No doubt the S&P500 looks like a 3 wave move off the low. However, there have been many occasions in the past where the S&P has staged a strong breakout despite this. Look at the examples below. Every Elliottician will be labelling the current setup as a iii of (iii) of 5. I am yet to see anyone successfully predict/anticipate a iii of (iii) and they are in fact one of the most fadeable patterns out there. Dont be that bear looking for the end of the world- they are black swans.

S&P500 2010
Note the initial rally off the July low was a clear 3 wave push. The market tried to retest but put in a higher low. This led to a significant breakout and rally. Interestingly, this breakout occurred as the market began to price in QE2. Same again with QE3 around the corner?

S&P500 2006:
A similar 3 wave push and retest was the initial pattern before this strong breakout
S&P500 2005:
In 2005 the S&P formed a very similar pennant/flag type pattern to the current setup. There was a higher low that formed that led to a significant breakout.
And finally to the heart of the crisis- the DAX. This is now forming a classic ending wedge pattern right at the 61.8 fib retrace level off the 2009 lows. I dont know what will trigger the breakout, but I do knnow there are a lot of shorts out there and Central banks doing everything they can to fix things.

DAX Daily:

In sum, I think the markets are on the cusp of a major breakout. Obviously there is some work to do before this can be fully confirmed but I am happy to get some risk on board first and then see how it plays out.

Thanks
Austin