Tuesday, 13 December 2011

Tuesday Double Bottom?

Morning All,

Firstly, I have added an Email sign up function to the site. Glenn (Kooke boy) made the suggestion and I value this input. Thank you. Pls sign up so you can get my posts delivered straight to your email.

Well yesterdays trade idea was spot on but unfortunately the intraday action made it difficult to exploit. Once again, we saw the real move happen in the SYCOMM session, with the SPI breaking down through support in the 40s around 6pm Sydney time. As I stressed, if you are going to Swing trade these markets at the moment, you just have to be at your screens for the first 2 to 3 hrs of European trade.

In Yesterdays post I said: "I am looking to short with a potential move back down into the 40s at a minimum and lower for a gap fill. As per the charts below, the SPI has rallied right back into the previous breakdown zone which represents a great short term sell level with tight stops. Thus, I will be looking to fade early at 4260 with tight stops and will short more aggressively at my outlier levels of 4287/4290".  


I showed this chart/setup yesterday and this is how it played out: 


As you can see, my levels were certainly off yesterday as the market opened at 56 and quickly surged to a high of 78. Thus my initial 60s level was overthrown.I didn't get the chance to short in the 80s and from then on we drifted and chopped for the rest of the session. We also saw a false breakdown late in the day which would have trapped some short term day traders (myself included). I love looking through these examples however. Markets very rarely play out exactly according to plan and thus going through setups and examples is a great way to train ones mind. 


SPI 5min gap
My gap entry to get short was a 5min close below the established low of the day. As you can see, there was no follow through and I was stopped out at the end of day only for price to breakdown later overnight. The key here was being flexible enough to re-enter the short when the next signal was given


SPI 5min ii
You can see the real breakdown came in the after hrs. Now price is right into the support zone. 4188/4190 was Fridays day session lows. 4170 is the Sycomm lows. 


Thus today, we are indicated at 4196 and thus right back into Fridays lows. This sets up for a great double bottom trade, one of my favourite low risk/high reward LONG plays. This is how new trends begin. Furthermore, Tuesdays are my reversal days so if ever we are going to put in a genuine low or turning point, today is the day. I think we may see a bit of weakness to begin with, but will be looking for buy setups into my cited levels below. 


My initial range today: 4170 to 4210. Outlier levels 4150 and 4125.  


My plan today: I will use 4200/4205 as an initial level to get short for scalp trades only. I think we will see initial weakness and thus this is a great level for day trading shorts. If we break above 4210, then I will have to join the long side adn the breakout. I will be looking for long trades at the Double bottom support areas. This is 4188/4190 (fri day session low) and 4170 (sycomm low). I think the 4170 Sycomm level has a better chance of proving to be a genuine low and thus I will be aggressive here. When playing these double bottom trades, remember to be nimble and keep risk tight. You can always keep trying but do not risk too much


Thanks
Austin


Monday, 12 December 2011

Mondayitis

Morning All,

On Friday, I talked about covering shorts into SPI 4200/4220 and S&P500 Emini 1225/1230, and looking for long setups:  http://swingtradersedge.blogspot.com/2011/12/morning-plan_09.html.

This did eventually play out v.well but the real move came after hours in the SYCOMM session once again. If you are a swing trader and trying to capture these moves in Australia, you really do need to watch the first 1 or 2 hours of European trade or go home flat. There was some late selling pressure during Asian hours on Friday with the SPI even breaching the 4200 level and trading as low as 4170. However, we saw a solid bullish recovery off this low and this is indicative of a longer term swing low now in place!

The SPI is indicated at 4250/4260 this morning thus representing a 50 to 60pt gap up. AUD has done little since re-opening post the weekend thus doesn't offer any particular clues.  A much quieter week on the Economic data front in Australia. Eyes will be on the FED meeting come Tuesday.

My Range today: 4220 to 4265. Outlier levels 4287/4290.

My Plan today: My gap strategy is firmly in play today and thus I am looking to short with a potential move back down into the 40s at a minimum and lower for a gap fill. As per the charts below, the SPI has rallied right back into the previous breakdown zone which represents a great short term sell level with tight stops. Thus, I will be looking to fade early at 4260 with tight stops and will short more aggressively at my outlier levels of 4287/4290 but I doubt we will get up that high today. There should be support at 4245/40 and any move into 4220/4230 should be used to cover any initial shorts.

As per above, I do think we have now seen a good swing low in place. I am looking to get long to exploit this at the right level vs stops at 4170. Tuesdays are my trend days and thus I will be looking tomorrow as a more likely day to get long.

SPI Dec 15mins:
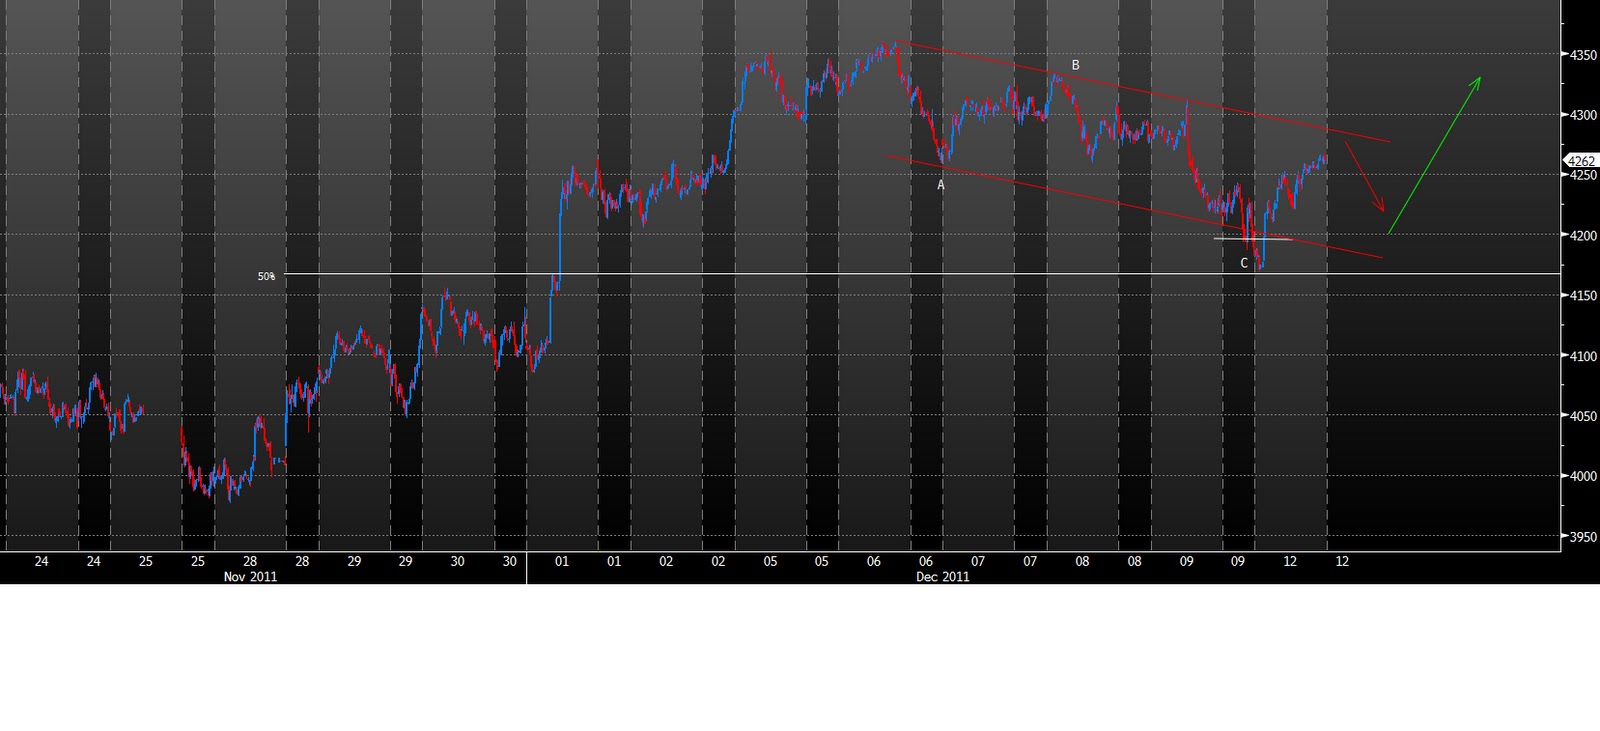
A clear ABC move off the high and a failed breakdown through support/low end of the channel. Thus, I think we have a bigger picture swing low in place coupled with a bullish Daily setup. Thus, look for dips in the coming 24hrs to get long vs 4170
SPI 5mins: 
Retest of previous breakdown level should provide some short term res. Thus as a short term trade, I am looking to fade this mornings gap.

Friday, 9 December 2011

Morning Plan

Morning
Since the start of the week, I have been consistently bearish and looking to fade the Australian market: http://swingtradersedge.blogspot.com/2011_12_05_archive.html

The targets for this move were 4260 and then 4220/4200. Last night the SPI futures finally broke the 4260 level and closed at 4216 thus fulfilling the forecast from the start of the week. It is unfortunate that so many of these moves are happening in the SYCOM night session with little intraday activity. It is what it is.

4220 was my potetenial A=C target off the high. 4210/15 also represents the 38.2 fib retracement from the recent high to the November 25th lows. We also have formidable round number support at 4200. Thus all in all, I think we have now traded from one extreme to the other and are coming into decent supports. I will now be looking for buy setups and covering all shorts.

My Range Today: 4205 to 4245

My Plan Today: We are looking at a 50pt gap down this morning into a potential zone of support. Thus, my gap strategy is firmly in play today. I will wait for a morning range to be established and then I will buy a breakout of the morning range (first 10 to 15mins) should it materialise.  Ultimately, I think any shorts will need to be covered at 4205/4210 so the risk/reward does not favour the shorts today I believe. I will be scalping from the long side at 4200 and 4210 should I get the chance. It may be a subdued trading session ahead of the weekend and the European Summit and given the large gap already.

SPI 5mins
A=C target
SPI 15mins
38.2 retrace comes in at 4215/4210. Also low end of potential trend channel

Emini S&P500 15mins:
I showed this pattern several times over the past few days. Sure there were a few false dawns but ultimately this 3 Indians/Ending pattern has played out perfectly with a false breakout last night and follow through to the downside. The key with this trade as ever is understanding risk/reward. Shorting res at 1260/1265 with stops ABOVE 1270 as per my twitter post was a great low risk/high reward trade. As Paul tudor Jones said "I develop an idea on the market and pursue it from a very low risk standpoint until I have repeatedly been proven wrong".  Amen

The targets for this move in the short term comes in around 1225/1230. 
 Thanks
Austin
Thursday, 8 December 2011

Delayed Morning Report

Morning All,
Unfortunately this is going out a bit after the open today. I had a meeting which went on.

Yesterday I wrote:  I think I would like to see a test of 4265 once again at a minimum before I can even begin to call a low in place. We also need more "time". Last night the SPI hit a low of 4260 and bounced relatively strongly back up to 4300. 


Thus, a clear range has been established from 4260 to 4320. Usually, if the SPI is going to make a genuine low/double bottom, it will do so during the day session. I have been bearish the last 2 sessions and todays open has not altered this stance although we have to give credit to how well the market has held in thus far.  Perhaps everyone is awaiting news come Friday. 


My range today: 4260 to 4305. Outlier levels 4250 and 4320.


My plan today: Todays open has been weak and price immeadiatly sold off from 4300. I am short with tight stops above 4300, looking for a retest of Sycom lows at 4260/65. If we trade down there, I will look to cover and scalp from the long side. The low 80s may also proved some minor support for scalp longs. The ultimate target for this move could be as low as 4200/4220 but we need the 60s to break first which I don't think they will today. I will not change my bigger picture bearish outlook until 4320/25 is breached to the upside.


Employment data out at 11.30am


SPI 5mins
Tested and held 60s overnight. However, bounce does not look impulsive


Eminis 5 mins:
Last night I tweeted that eminis were a perfect low risk short at 1265. This worked great and the move was right into the 40s which was the target zone. However, that bounce was certainly strong off the low. Clearly we are building a consolidation pattern here. Looks like it wants to breakout in time...but not yet

Wednesday, 7 December 2011

Morning Plan

Morning All,

Yesterday's action in the SPI went right on plan:http://swingtradersedge.blogspot.com/2011/12/reversal-tuesdays.html. I talked about the tiring trend, the double top in place, and reversal tuesdays, and this all led to a great trading day for the shorts with a move down to my target of 4265/4270.

I wrote: "we saw strong support at 4295/4300 and this should very much be the case again today. Look to cover there and add/re initiate shorts on a break of this zone with a potential move down to 4265/4270"


The SPI is indicated at 4300 this morning thus representing a gap up of some 30points. I do not think that this sell off from 4350 is done just yet. Note that we had an interest rate cut and yet price only rallied for 1minute before resuming its downtrend. This is indicative of weak underlying price action for now. I think I would like to see a test of 4265 once again at a minimum before I can even begin to call a low in place. We also need more "time".  


My range today: 4265 to 4325


Outlier levels: 4250 and 4345


My Plan today: Once again, I will be looking to short early. The best areas to get short today will be on the open with tight stops (limit 4300) and at 4320/4322 which was yesterdays highs. Any move above 4325 opens up a potential move to 4350 so be on watch for this. Remember day trading is all about being flexible. On the downside, 4260/65 should offer good support. My ultimate target for this move is as low as 4200/4220 but I don't think we will be seeing that today. 


SPI 5mins
Target hit yesterday i.e. right into the previous breakout zone. If we sell early today at 4300, I think the bigger picture target is 4220/4200. 
S&P500 Eminis
Refusing to crack for now. Obviously 1260 has acted as good resistance. Bulls should look for breakouts above that level, bears should use closes below that upward trendline to short. I think this is a good risk/reward short still.

Tuesday, 6 December 2011

Reversal Tuesdays

Morning,

My bigger picture thoughts remain here: http://swingtradersedge.blogspot.com/2011/12/little-present-from-santa.html.

In the short term, this uptrend continues to wane and I have growing conviction that we are set for a decent pullback today. Headlines that S&P have put 15 countries on credit watch should certainly act as a short term catalyst although AUD has taken this announcement very well. However, as ever we let the underlying price and the technical picture be our guide.

Yesterday I wrote "Thus all in all, I am looking for potential fade trades (going short) in the next 24/48hrs. This is fighting the short term trend and is a short term trade only. I usually look for reversals on Tuesdays so today's bearish outlook may be premature.  However, the risk/reward and technical outlook favours this setup.....The latter level at 4350 offers a great low risk fade level."


Last night the SPI rallied right up to the ideal 4350 short level, reaching a high of 4360, before falling 30pts to close at 4332. The chart below shows the perfect setup last night. As you can see, Price tested the double top area and sold off, potentially completing a 5 wave advance out of the recent triangle. Couple this with the bearish divergences I am seeing, the waning breadth, and a potential 3 Indians/Ending Wedge in the Eminis, and I have to remain a seller. I have often found that Tuesdays are a great day of the week for reversals and trending moves (don't ask, it is just experience).  


My range today: 4280 to 4340 (wide I know)


My plan today: The SPI is indicated at 4332. I would be a seller early in the mid to high 30s. Stops should be placed above 4345 or 4350 depending on your timeframe. Yesterday we saw strong support at 4295/4300 and this should very much be the case again today. Look to cover there and add/re initiate shorts on a break of this zone with a potential move down to 4265/4270. The SYCOM highs are at 4360 and ultimately any move above there invalidates my bearish interpretation leaving the potential for a move to 4400 in coming days. 


The RBA interest decision at 2.30pm will be a major catalyst. Day traders should be flat into this. The market is pricing in a 63% chance of a cut currently. I think they will cut for what its worth.


SPI Dec 5mins:


Emini Dec 15mins:
A 3 Peaks pattern and Ending Diagonal pattern. Looking for a breakdown to 1220. 
Thanks
Austin

Monday, 5 December 2011

SPI/ASX200 Morning Thoughts

Morning All,

Last night I put up my thoughts on where this current market stands: http://swingtradersedge.blogspot.com/2011/12/little-present-from-santa.html. I encourage you to pls read.

Going forth, I will write a morning Trading plan and outlook for the Australian market pre-open. This is more of a short term perspective for shorter term traders. This will come alongside my usual posts and updates. I value any feedback as ever.


This mornings open has a positive tone vs Fridays close. AUD is up some 60pips from the open (+0.5%) and EUR is up 35pips. The SPI is indicated in the region of 4300/4310.

The current rally in the ASX200 off the 3975 low is slowly running out of steam and tiring. You can see the bearish divergences on the 15minute chart below despite price making new highs. This is not indicative of a strong breakout. In the bigger picture, we are also now approaching the top end of the recent range namely 4300 to 4400. Friday nights trading left a bearish reversal candle with a high forming at 4350. Thus all in all, I am looking for potential fade trades (going short) in the next 24/48hrs. This is fighting the short term trend and is a short term trade only. I usually look for reversals on Tuesdays so today's bearish outlook may be premature.  However, the risk/reward and technical outlook favours this setup.

My range today: 4290 to 4325. Outlier levels are 4265 and 4350.

My plan today: The open will be very important today with 4300 a key area. I will be looking to short should the market fail to hold above 4300 early and will use a break of 4290 as my trigger to short. Breaks above 4300 will open up moves to 4325 and potentially even as high as 4350. The latter level at 4350 offers a great low risk fade level. There is a lack of data today so I am not expecting big moves today.

SPI Futures December 15mins
SPI Futures Dec 30mins
Coming into top end of range. 4350/60 and 4400 were the previous highs. I expect the market to struggle up here if it hasnt already found a high.
Big Week for Australian Data- Interest rate decision on Tuesday, GDP on Wednesday, and Employement data on Thursday.


Thanks
Austin
Sunday, 4 December 2011

A Little Present From Santa

A lot has happened since my last post. It is amazing that during just 1 1/2 weeks away from the screens, the picture of the market has altered so dramatically. I guess that is the nature of the current volatility.

I could go into depth about some obvious setups in the week prior but that will do us no good. We deal with the present. I have always stressed that being flexible is key in successful trading. I feel this is very much one of those times to respect the underlying bullish price action. My past posts of late have all focused on the bearish trend, the markets failure at the 200 day moving average, and the bearish parallel with 07. As I scan across charts, it appears very clear to me that we have now decoupled from this scenario. Is this just a bear market rally? Quite possibly but I believe this will continue to move higher in time and price before any meaningful pullback or trend lower. Look for a continued move higher at least into the first trading week of January.

In the short term, it looks like Friday's Jobs reports led to a high. Use this pullback and retracements levels to get Long into this new trend higher over the coming days. If 1200 is breached to the downside, we know that this indeed is a bear market rally and one giant headfake for bulls.

Here is a rundown of markets as I see them:

AUSTRALIA Daily:
The Chart is a bit of a mess right now. However, price closed higher everyday this week! This is indicative of a KICK OFF new trend higher. We are headed for the 200 day moving average at a minimum. In the short term, Friday looked like a short term blow off top. Use the pullbacks and dips to get long.

We have a 3 wave rally up and a 3 wave rally down, thus my natural inclination is to think that this market is headed higher in a 5 wave move to complete a flat. I was shown a very interesting parallel by a colleague Kurt Dalton a while back, and it appears this is playing out with precision with the 2010 advance. The target is right up to 4600/4700 which is an open gap and the 61.8 Fibonacci retracement and I expect this to be hit come mid January.

ASX200 Current:
2010 Parallel:
Note the 3 wave ABC moves followed by a Kick off candle and strong trend higher into the open gap target.

DAX
A failed Head and Shoulders patterns. FAILED PATTERNS ARE THE BEST and I have consistently stressed this in the past. We had a confirmed break of the neckline which set off stops and short trades. However, price has now recaptured this level with genuine strength. Looks like a classic bear trap. Join this move higher in coming days with ultimate targets at 6500/6600.
S&P500
That one closing candle says a lot. Jack Schwager calls these candles "wide ranging days" which in themselves are a trading signal to get long, with stops below the low of the candle i.e. 1200. Wednesdays strong upside day was also on volume of 1.5bln which makes it one of the best I have seen in months. I think a natural target for this move higher is back up to 1300/1315. This is the FIRST time we have decoupled from the parallel. If this was a genuine trend lower/breakdown, price would not have rallied this high so quickly. 1200 has become my marker and line in the sand- bulls are in charge as long as we hold above there and I am looking for pullbacks from Fridays high to get long.


To be clear, I am not saying we are going to new highs. I still believe we have a Market high in place and a bigger picture bear trend in play. However, the market may just need more time to consolidate and rally before a genuine move lower can begin. I want to go with that strong candle and not fight it for now.

These are all Daily charts and bigger picture scenarios. Going forth I will also write a Daily short term trading post pre-open for the SPI/ASX200. I realise a lot of my readers are looking for more short term actionable ideas in our local market and I now have more time to deliver this material.

Thanks
Austin

Wednesday, 30 November 2011

Back From Break

Morning All

I apologise for the lack of updates but I took sometime off at the end of last week. The Blog has been having a great run of late and it is always good to step away for some fresh perspective and re-charge the batteries.

I will have a full run down of analysis and where I think we are at later in the day.

Thanks for the continued emails and comments. Nice to know that people are out there craving for the analysis :)

Austin

Monday, 21 November 2011

Monday Musings

I like to ramble on a Monday morning. Rather than a long descriptive narrative, I thought I would jot down some of my thoughts as we start the week.

-This blog has been consistently bearish since the S&P500 and DOW hit their respective 200day moving averages. This trade has worked v.well thus far and I don't see any reason to change this stance from a bigger picture perspective. See:
http://swingtradersedge.blogspot.com/2011/10/short-term-high-is-in.html AND
http://swingtradersedge.blogspot.com/2011/11/i-am-bearish.html

-However, in the v.short term I see markets holding in and a potential long trade setting up. Volume has not picked up despite the breakdown, potential bullish divergences are forming and we are coming into a great zone of support in a few markets. Gap downs on Monday mornings often prove to be a good buying opportunity for the nimble.

-The key levels to watch are 1200 to 1210 S&P500 (Eminis 1205 last). Markets had a consolidation day on Friday and I see this move lower on Monday through consolidation as a potential final move lower. This area marks the 38.2 retrace, a potential A=C move, and previous breakout area.

(Update The Eminis are trading 1195 last. This is probably too low. Only a buy if price recaptures 1205/1210 when the Yankees get in. If not, keep focusing on that bigger picture bearish scenario.)

-The target for any long trade should be no more than 1225/1230. This market is only bullish if we can recapture 1250+

-The bigger picture is bearish. We have topping patterns across many markets in place; we have 5 wave impulsive moves off the top; and we have a confirmed DOW Theory Primary trend change to bearish. The bull market trend from the March 09 lows to the May 2011 highs lasted roughly 26 months. The sell off to the October lows was only 5 months and thus not even 20% of the time of the preceding bull market. We need a lot more time to consolidate and work off the previous bull trend excesses. I anticipate this bear phase to last at least 12 months.

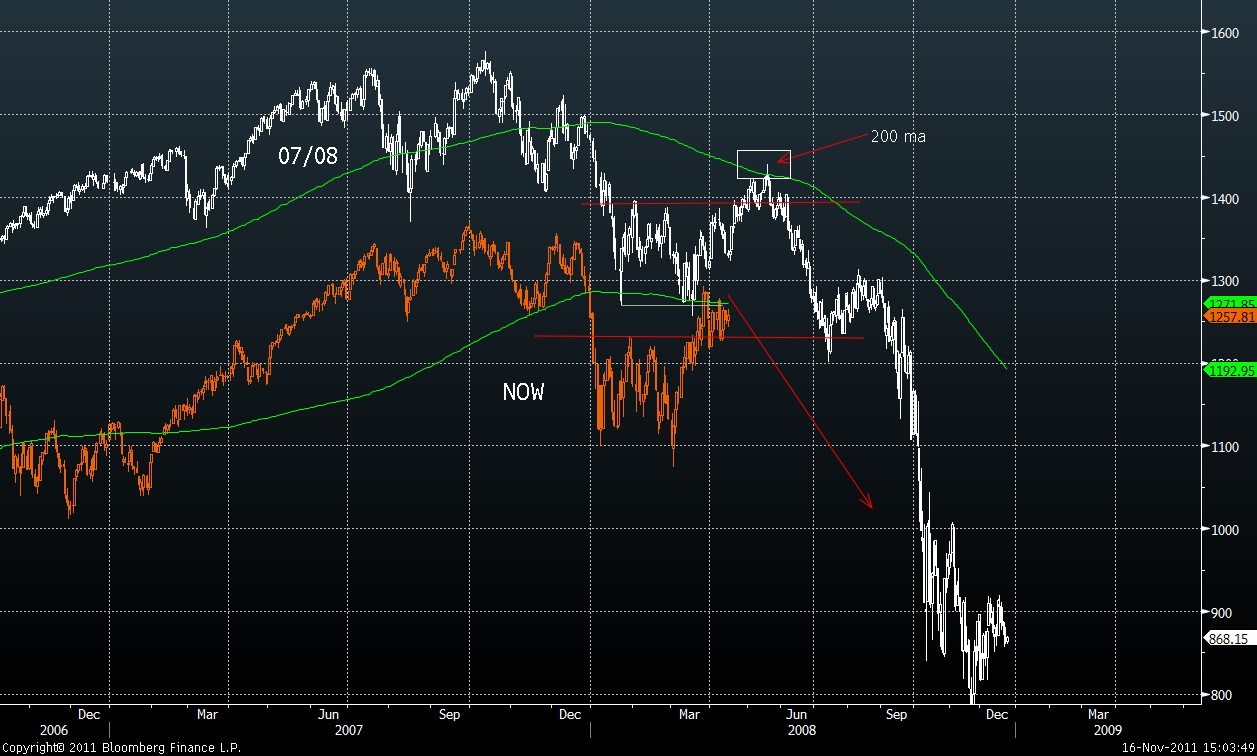
-Any failure to bounce meaningfully out of here is bearish and confirms the above. The market failed from this exact zone in 2008. See below. It may not look impulsive of late but if this zone eventually goes, dont hang around.

-The DAX and EUROSTOXX have not made new lows of late. One could argue this is forming a bullish base pattern i.e cup and handle. If we see an upside breakout of this wedge/handle pattern, this could really change my big picture bearish stance. Counter this though with the Nasdaq which has triggered my Head and Shoulders top

-The ASX200 is trading at the low end of its range. The levels I am interested on the long side are 4150/55. Tuesdays are my reversal days and I will be looking for this tomorrow.

S&P500 Support Zone:


S&P500 Support Zone in 2008

S&P500 When support goes......

Wednesday, 16 November 2011

Some More Bearish Stuff

Morning,

I just wanted to continue on the recent theme I have been drumming home here- I continue to see underlying weakness across markets. CDS prices in Europe continue to make new wides. France, Spain and Italy all made new all time highs last night. Yields on sovereign debt continue to blow out. This despite new heads of state being installed and a Trillion EUR pledged bailout. I don't know what positive catalysts there are still to come but clearly the markets are not paying attention. The US "Super" Committee is also due to release plans to slash $1.2trillion in debt and expect increasing nervousness ahead of this and mumblings of more downgrades if they cant get their act together. I don't have too much faith in them. Most importantly, the technicals are not healthy here and abroad.

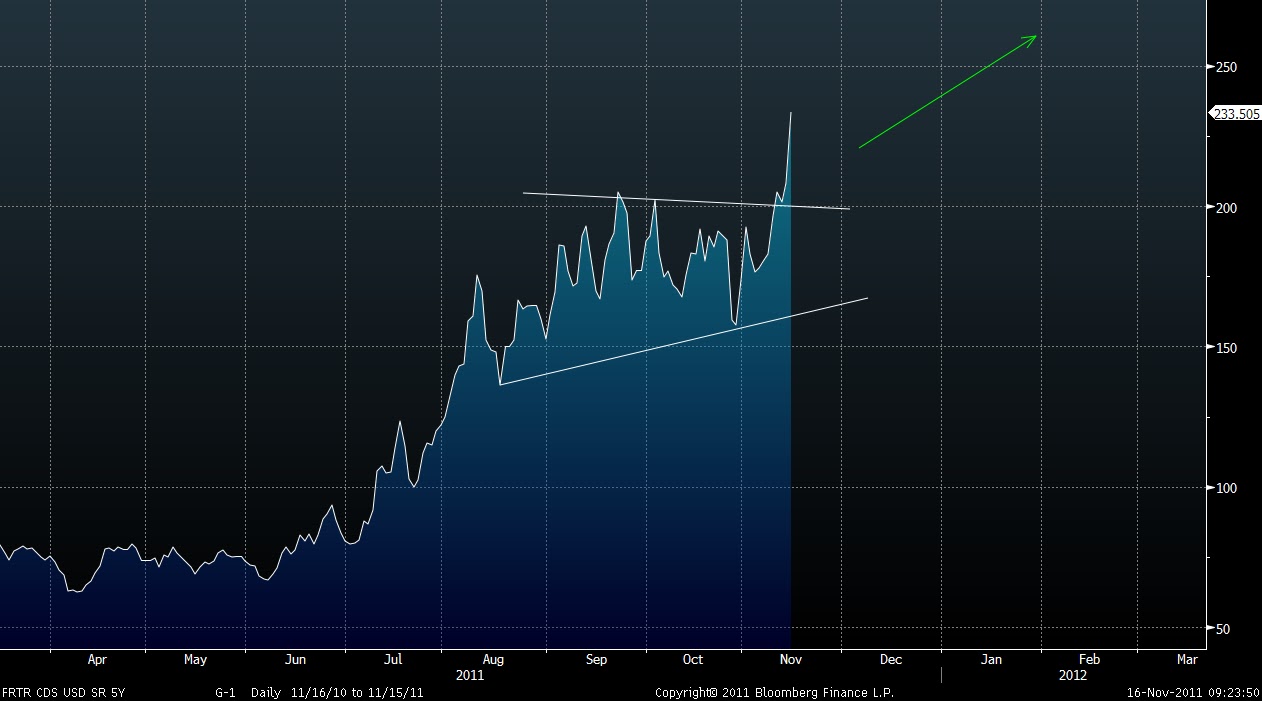
France CDS Daily
Breakout to new highs. 2nd biggest economy in the region. All looks healthy here............


I showed a number of bearish patterns in overseas markets in my last few posts: http://swingtradersedge.blogspot.com/2011/11/monday-musings.html
http://swingtradersedge.blogspot.com/2011/11/i-am-bearish-take-2.html


Monday I talked about selling the Emini S&P500 at 1265/1270 looking for mid 40s. This worked out well. That market is obviously in some kind of triangle pattern and volume has continued to dwindle throughout the pattern. We await the breakout either way but I just don't think it will be an upside breakout. The DAX is also flirting with that neckline.

However, I wanted to focus on this post on some confirming evidence here in Asia.

BHP Daily:
The recent stalling action is all indicative of a Wave 4 type pattern. I have labelled a very valid count here. Note the strong bearish reversal candle at $40 and the minor 4 of lesser degree. The bigger picture trend is down and the recent short term rally has run well out of steam. A break of that trendline should initiate a move down into the previous lows and beyond.

RIO Daily:
A Similar count. Note the continued failure to break above $70. This stock is clearly offered. Looking for a breakdown in coming days.

CBA Daily:
Another big component of the Index. The Banks have been major outperformers vs the miners. Nonetheless, CBA tagged the 61.8 retrace and the 200ma and reversed. Up here, it is a low risk short for a move back to $46. I could see Miners making a new low whereas banks make a higher low in time.

ASX200 Daily:
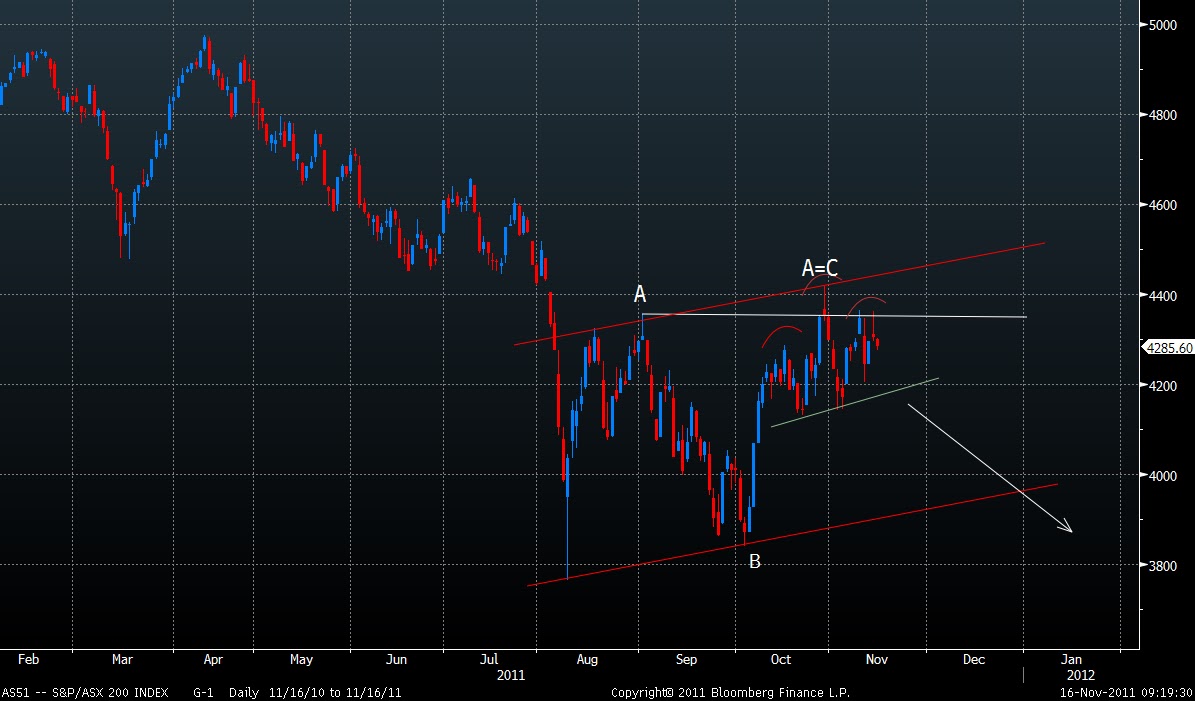
The best risk reward trade here remains selling/shorting up here with stops above 4400. We have a perfect A=C move off the low. We have price reversing off previous highs and at the top end of the channel. We also have a potential short term head and shoulders pattern forming. Any move below 4200 in coming days would trigger this.

AUDUSD 5 days:
The barometer for risk. A market that breaks out from a base pattern and retraces all of its gains and more is not healthy. As per my last post, we have a bigger picture Head and Shoulders pattern in play.

So all in all I remain nervous. The patterns, the fundamentals and the tape are all indicative of a tiring market rally. Perhaps we do breakout to the upside in the S&P500 and I will be forced to join for a trade only. However, I view a BREAKDOWN as more likely.

Thanks
Austin

P.S
Havent shown it for a while. That 200 day capped the rally in 08. Done the same again this time. Hold onto your seatbelts

P.P.S
(UPDATE)

ASX200 Intraday
Opens +0.4%, Closes -1.5% on lows. Nuff said


Monday, 14 November 2011

Monday Musings

Morning All,
A rather lacklustre start to the week here in Asia. We gapped up 1.5% the open on thin volume in Australia and we have slowly grinded lower throughout the day (just closed FLAT!). I thought I would keep it rather simple this morning and run through a number of things on my mind.

ASX200 Today:


Thoughts
-Fridays rally in the S&P500 was on woeful volumes of 790m only due to Remembrance day. This is the lowest I have seen in months and not indicative of a new impulse move higher.

-The pattern in the S&P500 looks like a clear triangle. A break above 1275 should trigger a "breakout" but I would be very hesitant to join this move given the patterns across other markets and the continued failure at the 200day ma. IN FACT I AM SELLER AT 1265/70 WITH TIGHT STOPS looking for a move back down to the 40s

-The DAX, NASDAQ and AUD, EUR all show very clear Head and Shoulders patterns. These are not my favourite patterns but no doubt they are as clear as day to see. Does that make them invalid? Context is the most important thing in pattern recogniton and note that these patterns are forming after a sustained rally off the October lows that has alleviated a lot of the bearishness. These are the best conditions for putting on shorts.

-There was a potential false break on Friday that got may have got some bears covering. The volume in futures and equities does not validate this however. The market has now rallied sufficiently into great levels to put shorts on. The real trigger comes on close below those supports. When support drops, you got to join it.

-If I had told you 2 months ago that the market would be 12/13% higher, what would you do? I think you would have seen this opportunity as a gift from the gods to get out/get short. Now has anything really changed?

-My major concern for the bearish scenario is the concept of TIME. I have reiterated this a few times. The sell off from the high to low was 5 months. We should expect the rally to be at least 1/2 the time of this i.e. 2 months+. We are closer but not there yet ideally. Furthermore, end of November/December is often seasonally a very strong time of year given end of year dressing This is when all funds are bench marked and trust me, it does have an impact on stocks. That doesn't get investigated though.

NASDAQ 100 60mins:
Looks like a topping pattern to me. Needs confirmation.


SPX 500 60mins:
The market held right onto the trendline I showed here last week. Could be a triangle. Bears need this to drop and soon.

DAX 60mins:
Looks like a H+S to me as long as price doesnt break 6200 on the upside. I would short into this with stops above 6200. Add if we break Fridays lows.


AUDUSD
Another interesting topping pattern playing out potentially with a right shoulder forming. Price should not break above 1.04

EURUSD
False breakdown on Friday that will have bears frustrated. If this rally was to run out of steam and price retraces to Fridays lows, then the pattern really is in play.


Potential 5 down and rally into previous 4th/resistnace?

Thursday, 10 November 2011

I Am Bearish Take 2

In my last post I talked about a number of bearish setups forming across markets. After recent price action, I have even more conviction that we are on the cusp of a major breakdown. The recent rally has failed spectacularly despite huge pledged government intervention. There are cracks appearing everywhere. Really it is all down to the ECB now and the only solution I see is if they pledge to cap the yields on these sovereign bonds. Otherwise, this market could really get out of control.

S&P500 Daily:
A double failure out of the 200 Day moving average. Yesterdays closing candle was ugly indeed. These reversal candles are indicative of a climatic turning point! A break of 1200 in coming days would seal the fate. Also note that we have had a confirmed Dow Theory Primary trend change indicating the transition from Bull Market to Bear market. I will show this another time.


S&P500 2008
I keep referring to the 2007/2008 parallel. Back then the market topped out right on the 200 day moving average. We then retested the previous breakout zone and once support went, the real collapse began. Look and feel kinda similar?
.

S&P S&P 500 15mins:
We have a possible Head and Shoulders pattern forming in the short term. Any break of this trendline overnight will lead to a move down into 1205/1200 at a minimum


DAX Daily:
A classic failed breakout. We had a great base pattern that formed below 6000 and the subsequent breakout failed spectacularly on the 50% Fib retrace. This does not bode well


DAX 60mins:
Another clear short term topping pattern in place. Look for breakdowns of this support.

AUDJPY
Bearish reversal out of the 61.8 and the 200day moving average. It doesn't get much better and clearer than this. This is the barometer of risk/carry trade.

If this plays out, Asia is going down. I thought that this rally would take a lot longer to play out down here but we may not have this luxury. I will not hang around to find out either.

Austin

Tuesday, 1 November 2011

I Am Bearish

Morning All

Since I last posted, the market slightly overran my 200day moving average targets. However, given the price action over the last 2 sessions, I have increasing conviction that we have seen a meaningful high, a high that may even mark the end of this Intermediate rally. I just don't see a good risk/reward trade being long up here.

I have lots of interesting charts here. These are predominately US/European charts. The setups look clearer to me overseas. It is a shame as I predominately trade Asian Indices but right now the world is being driven by these regions so we have to be on the front foot.

S&P500 Parallel
Lets being with my parallel chart that has guided me so well throughout. We have seen the sharp snapback rally post the double bottom squeeze. In 2008 the market topped right at the 200 day moving average as shown. And now, the S&P 500 hit that same 200 day moving average on Friday and has now reversed. If this plays out, there is a long way down.


S&P500 200 Daily:
The S&P overran the 200day but has swiftly reversed. That reversal candle is bearish indeed.

DOW Full Moon
I thought this was interesting also. I have often commented here that full moons are associated with market turns. The white lines on this chart show the date of the full moons over the past 7-8 months. Note how the market weakened significantly on most occasions post the full moon. Eerie. Yesterdays action could be a sign of things to come.

EURUSD Daily:
A very bearish reversal candle right out of the 61.8 Fib and the 200day. The EFSF rally lasted a whole 3 days and has been completed reversed! Not a major vote of confidence. A potential C wave could well be underway now and this will be sharper than the initial decline.

Italian Bonds vs SP500
They say that the bond market leads risk assets. Here we have Italian Bond Prices in white, SP500 in orange. Well this chart shows a clear divergence between the two. Why are European bonds continuing to fall despite this bailout package? Are equities factoring in whats going on under the hood? Not healthy at all. Expect this Gap to contract i.e. S&P500 to stage a major bearish reversal.
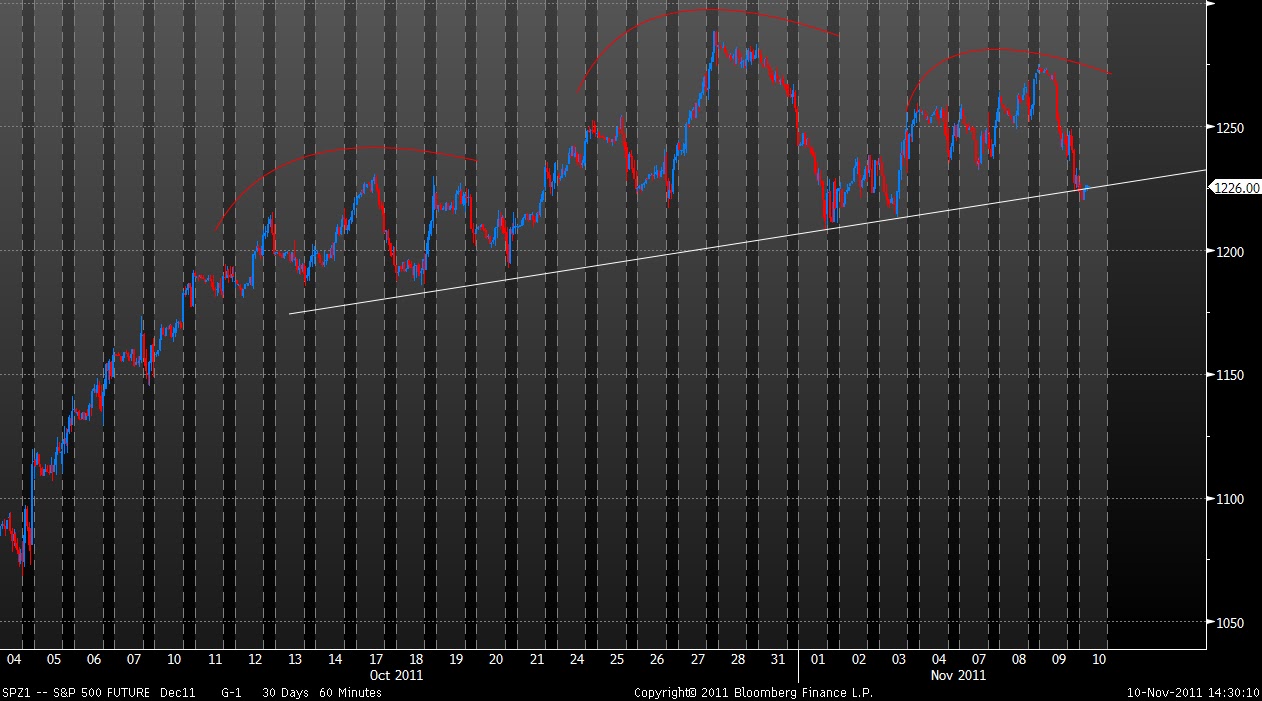

The major issue I am grappling with is the concept of time. This rally has reached my price targets very quickly across markets. I thought it would take a lot longer for this rally to play out and perhaps we do need more time before calling a top. Has all the bearishnesss evaporated already? Seasonally, we are coming into a strong time of year and this throws me off somewhat. However, price is of primary importance and we are firmly in the sell zone.

ASX200 Daily:
Australia has rallied right into the overhead gap and target. Price has confirmed this resistance with some bearish reversal candles. Once again, we led our overseas peers for the recent high. Also note the 3 wave nature of the bounce right into the top end of a channel. A great shorting opportunity in the coming days with stops back above the recent highs.

In sum, there is a lot of evidence to suggest that this whole Intermediate rally is over. I am often early in my market calls but that is the nature of trying to pick favourable risk/reward areas. Much as I positioned for the low, I am now positioning for a dramatic high. If this plays out, it will be a huge trade. In the very short term I think we will get a bounce and I will be using this to put on small shorts. I will add if I see more confirmation.

Good luck
Austin