Monday, 6 February 2012

S&P500 Update

Given Fridays blowout jobs number, the S&P500 obviously surged to yet another high. My double top fade vs the previous highs at 1330 (Emini futures) did not work but as I write, the Futures have pulled back to this level and I have decided to close my short at breakeven for now.

Obviously the continued strength in the US markets has thrown me off course somewhat, although I have managed to trade around some key levels with mixed success. To me this market is still to be treated nimbly. Certainly this market is overbought with the RSI of the Nasdaq 100 Daily at 78.55 and the S&P500 at 74! This is in very lofty and scary territory. But does the market care? Of course we will get a correction at somepoint but my ideal levels have been breached. Thus, I really dont know and I will now just sit back and watch the US unfold. I am looking for either a Climatic reversal pattern to form or a bearish candle reversal on the Daily. We dont have either. What we do have is a new momentum high on the lower timeframes thus I am looking to buy the first pullback for a short term trade. 

Emini S&P500 60mins:
The consolidation pattern I showed broke to the upside. I dont position ahead of major numbers. We had a strong number and before you could really capitalise, the market was trading at 1333 to 1335. We now have a new momentum high in place, and a retest of the previous high. I think this is a short term buy at around 1330, stops 1325, target 1340/1345. 

Emini S&P500 60mins ii
Interestingly, I showed these base pattern under the 1320 level the other day. If we take the width of this base pattern, and add it onto the neckline of the breakout level, we get a projection to 1342 which was hit on Friday night. I would like to see a retest of that level that fails before calling this done.


S&P500 Daily:
A strong candle on Friday. The saying "bull markets climb a wall of worry" seems more apparent everyday. In the bigger picture, we are now up against another host of resistance levels. Thus I still remain cautious up here. I don't know where this reverses. Here seems as good as any but price has no interest at the moment. 

DOW Daily:
Still in the Double Top zone. The small head and shoulders pattern did not play out on the lower timeframes. Once again, we now await a candle reversal.

EUR Futures 60mins:
A very interesting rounded reversal pattern here to me on the lower time frame. For now we are at the low end of the range and support. However, keep this one on your radar if it does crack.


In sum, it seems that many technicians continue to look for a top that just has not materialised. I guess I have been guilty of this although I have advocated  trading around the edges. Will this week and the full moon bring anything different? I really don't know. We bump from one resistance level to the next. If I see a reversal pattern, you will be the first to know. For now I don't.

Monday Plan

Morning All

I will put up a more detailed post on global markets a bit later. I just wanted to write out my plan for the ASX200/SPI here before the open.

My SPI Range: 4260 to 4285. Outlier level 4300

My SPI Day Trading Plan: I was looking for a retest of the previous highs in my past few posts. We are here today with the SPI indicated at 4275 early given Fridays strong move in the US. I will look to short fade 4280 and 4285 with stops above 4290. Longer term traders should wait for confirmation. I will look to scale out of shorts in the low 60s if we do get a move lower. 4255 could provide potential Long Scalping opportunities today. I will only look to get long and join this uptrend if we see some consolidation and holding of this morning gap up. Then I will join a breakout should that play out.

Friday, 3 February 2012

Friday Plan

Morning All,

An inside day last night in the S&P500 and thus I don't have too much to add this morning. My plan was to sell a retest of that 1333 cash high (1330 futures). Price looks to be consolidating and that would imply a breakout to retest those levels.

Emini S&P500 15mins:
This chart actually looks quite bullish with a big base pattern building under 1317/1318. My plan is to sell a retest of 1330 with tight stops. Short term breakout traders could use the boundaries of that consolidation pattern to get long or short. Its non-farms tonight and there is your catalyst.

S&P500 Cash 15mins:
I see a number of overlapping "3"s within this recent range. It is very possible to me that any retest of the Highs will be part of a B Wave with a sharp C wave lower to follow. Perhaps I am dreaming. We may have already seen a lower high, or another push higher to come tomorrow. Use that 1322 level as the line in the sand (1317 futures).

DOW 15mins:
My S&P500 pattern has added credit when I look at the DOW. This could be a H+S (although these patterns never work for me ha). Equally, we see a series of overlapping waves in this range. Like the S&P500, no new highs yet the NDX has managed to make a new high which is an interesting divergence.


All in all, price remains in a range with the broader trend up. I continue to trade the boundaries in the short term and continue to keep my targets small. My bigger picture view remains that we are building a high but price doesn't have any interest so far in the US.

To Australia. We are indicated at 4240 in the SPI this morning with the overnight high at 4250 and the low at 4225. Thus we are very much within yesterdays range. There is no economic data in Australia and with non-farms tonight, it could be a very quiet one indeed. Scalping the range could be the name of the game.

SPI March 5mins:
Yesterday we made out high at 4255 just above the 61.8 Fib retrace. Key res levels remain 4255/60 and 4285. Support comes in at 4225/7 and 4200


My SPI range today: 4225 to 4250. Outlier levels 4255/60 and 4285

My SPI day trading plan: As stated above, I think today could be relatively quiet and rangebound. My ultimate scenario is still looking for one more push back up to the previous high for a double top trade. However, early I will look to short fade 4250/55 and buy 4225/7. Price points in between that range will have to be determined as they day plays out. Look to get long and join the trend up if 4260 breaks to the upside, target 4280/5.

Thursday, 2 February 2012

Double Top Trades

Morning All,

The Emini S&P500 held the low end of the range last night in the low 1300s and we saw a violent squeeze during the European session. With the market rallying back up to 1317, price was way too strong for the Head and Shoulders pattern to be valid and I said on Twitter:

"$ES_F: this is way too strong for a head and shoulders. Thinking we now head back up to 1330. Trade accordingly"
 
I believe this move now sets up for a great Double Top trade. I talked about scaling into shorts at 1330 and just missed it last night. I believe we may get one more push higher. Interestingly there are some small divergences with the Nasdaq making a new high but the DOW and S&P500 failing to do so. It may be just a matter of time before they do so but either way, I view this as a good low risk double top trade here. This market has been trading in a broad 30pt range for weeks now and thus continue to treat it as such until we see clear confirmation either way. We haven't yet. Sell the top end of the range.
 
S&P500 Emini 15mins:
 
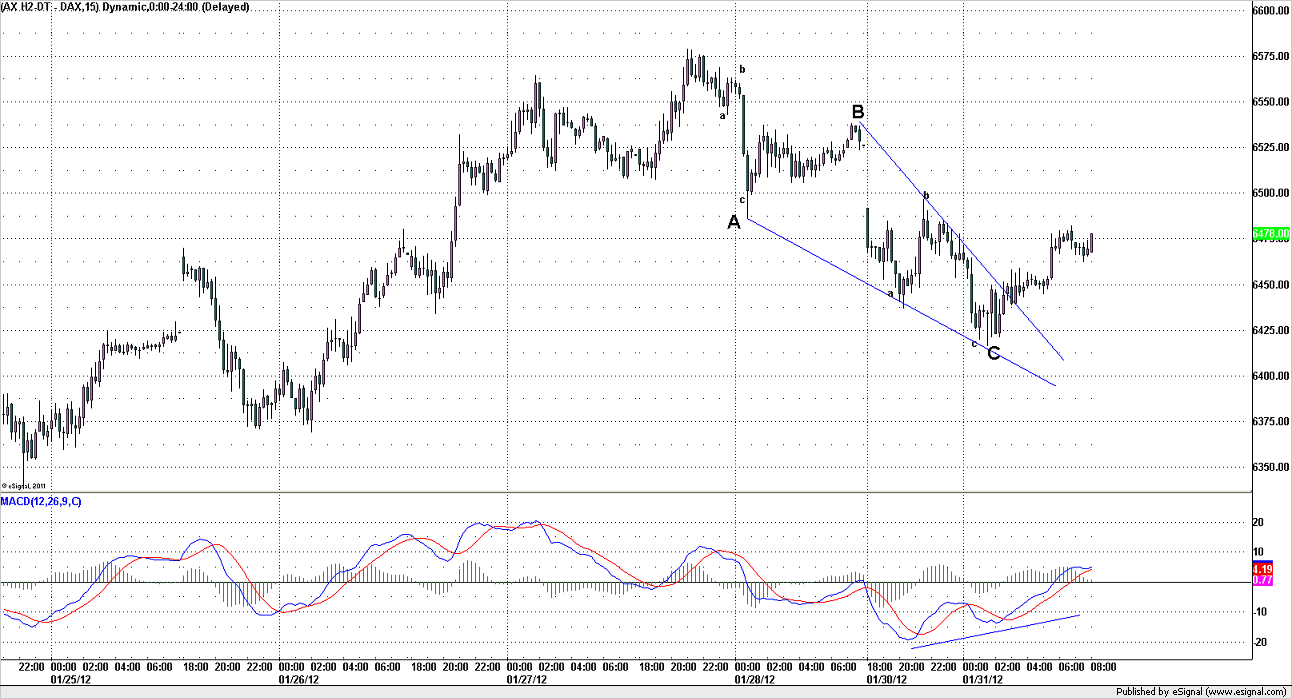
Certainly last nights move did appear strong, but it is interesting to note that the DAX has now clipped my 61.8 Fib retrace. Sometimes we do see a small overshoot of these levels before a turn so wait for a Daily confirmation candle.
 
DAX Daily:
 
DAX Weekly on the Low:
Don't forget this chart that I put up coming into the October low. Price had a small overshoot of the 61.8 but ultimately contained price. This is the power of these Fib levels as timing tools.
 
 
To Australia today. Yesterdays SPI plan and range that I wrote here nailed it yesterday, but my trading did not live up to this unfortunately. I did not really commit to the downtrend enough and I did not execute very well. There is nothing more frustrating then having a sound plan with many scenarios, and not delivering. All we can do is go over our mistakes, learn lessons, and improve for the next day.
 
I showed this chart on the weekend and it is worth reiterating. The Australian Daily chart has put in a Bearish Candle reversal right out of clear resistance. We saw confirmation of this top with the pullback over the last few days. Thus our highest probability trade is to sell a RETEST of that high.
 
XJO Daily:
200 ema clipped, candle reversal right at the top end of the range.


SPI March 15mins:
As I said above, our highest probability trade is to sell a retest of this high. This level is 4285 in the SPI and 4300/4315 XJO. We may not get there today obviously but plan for these extremes. Here I have shown potential fade levels at 4255/60 and then right up at 4285. I prefer the latter level given the ABC type structure but as ever, trade the charts. Note that yesterdays open gap proved to be the perfect target for the down move.
 
 
My SPI range today: 4220 to 4260. Outlier levels 4285 and 4184.
 
My SPI plan today: We are looking at a strong gap up this morning of almost 50points right into yesterdays high of 4240. I think such gaps need time to consolidate before we can push higher, especially given the prior 3/4 day weakness. Thus I will look to fade the open straight away if I see weakness out of the 40s. This is for a short term short scalp only. I do think we are likely to push higher at some point later in the day but I will wait for some consolidation before joining this potential new short term trend up. Note that last nights SYCOMM highs were at 4260 and this could well be the target today. If we do get as high as 4285 today, this would be an aggressive short although I view a move that high unlikely today.

Wednesday, 1 February 2012

Tuesday Reversal Indeed

Morning All

Our job as Traders is to make money. Simple as that. Whatever method you use, whatever your style, we trade to make money consistently. I write this blog to plan my course of actions, to demonstrate the setups I am looking at, and to share my thoughts with other traders. This is my path to success and consistency. Unlike most "educators" and technicians out there, I actually trade this. This is my livelihood.

No-one likes a gloater. My intention here is to show how I plan some of my swing trading setups and the results. Yesterday, I wrote this on the blog to plan my day ahead in the S&P500 cash:

"Tuesdays are often my trend reversal days. Its possible that we may see a move back up to retest the 1333 S&P500 cash highs on Monday/early Tuesday, and this would provide a great low risk short entry. I personally will scale in at 1320 and then more up at the previous highs. I think last nights strong bullish reversal is all part of this move to "retest" that 1333 high (cash). I will be getting out of my longs into 1310-1315 and looking for shorts in 1320s. Use your fib retracements, res levels, candle reversals- whatever it is you use.

Before I went to bed last night, the Eminis had rallied perfectly into my 61.8 Fibonacci level at 1317 (spot 1320), and I went short 1/2 position. I put this on twitter:

"$ES_F: Short at 1317. Feels too strong but if its going to turn, it will do it here"
 
"$ES_F: 61.8 Fib off the high comes in at 1317. Flipped out of long, and getting short there. Could it be????"
 
The S&P500 Eminis made a high of 1317.5 and then sold off all day. The S&P500 Cash made a high of 1321.5 and sold off for most of the session. A nice successful trade and now we move onto the next. Thats our job as traders- to make money.
 
If you want to trade these markets in this style, and if you want live updates, PLS GET ON TWITTER. I put most of my thoughts and trades up as they happen. Its all free. I really think this is of genuine value. Nuff said.
 
So where does this leave us? To me we are clearly right on the point of a genuine breakdown. If we retest that 1300 level again, I think we break through. Support will only work a few times before it fails. I have written in depth about why I think the markets are topping and please read the following posts showing clear Daily charts:
 
Eminis S&P500 15mins:
This was the 61.8 Fib level last night. This is the power of technical analysis.
 
 
Eminis Nasdaq 100 15mins:
Great double top trade and ending wedge/"3 Indians" right into resistance. To me, that has sealed it for this market.
 
 
Eminis S&P500 60mins:
Clear head and shoulders pattern in play. Yesterday I said that a bounce could form the right shoulder and here we are now.
 
 
EUR Futures 60mins:
Another possible Head and Shoulders pattern playing out


DOW Daily:
Double top. Reversal Candle. Small Head and shoulders pattern playing out. Do you want anything else?
 
 
In sum, markets made their high right into the key Daily levels. The S&P500 made a high at 1333 which is 666.5 X 2 (March 09 low). Momentum and breadth have been noticeably slowing and diverging into this high. Markets bounced sharply on Monday only to be slapped back down again on Tuesday which indicates that the bulls are losing control. All the evidence is there but we are still in the low end of the range for now. I have been banging on about how vulnerable the market is up here and that market tops take TIME. When this range goes, I anticipate quite a big pullback if not a substantial move lower.
 
 
SPI Range today: 4182 to 4240 (wide I know). Outlier levels 4250/55
 
SPI Day Trading plan: We are indicated at the low end of yesterdays range at 4234. Yesterdays late move was quite extreme and we bounced sharply out of 4222. Thus, any move back down to 4222 early should be bought with tight stops. It is possible we are oversold after a 3 day sell off but this is for a short term long scalp only until the trend changes. The short term trend remains down and thus I will look to short 4240/45 and more aggressively up at 4250. Note that if the 4222 breaks to the downside, I anticipate a move right back down to 4182 so be prepared for this. 
 
XJO 15mins:
1 trendline broken but coming into key supports at 4250/60. If this area drops, look out.
 

Tuesday, 31 January 2012

Bear Trap

Morning All,

I will keep this post relatively tight this morning as I had a rather late one last night trading the S&P500 Eminis. During European trade, the Eminis grinded lower and lower, and it looked set for a breakdown. However, I know from experience that these "tests" and breakdowns through support the first time round are often fakes. There were a number of patterns across markets that looked like corrective ABC patterns rather than new impulsive moves lower. I put this on twitter late in the evening:

"$ES_F: so does this thing crack or hold the neckline here at 1300s? I just have to buy support first despite being sooooo bearish"

I did buy the low 1300s with stops at 1295 and got v.v. lucky indeed. Sure enough, the market broke through 1300 only to trap the bears and a resulting strong squueze ensued. The S&P500 cash market gapped down, made a low in the first 15mins, then rallied all day. Encouraging price action indeed.

Here are some of the corrective patterns I was monitoring. Bullish divergences and an underlying higher time frame uptrend form important backdrops to these trades.

Emini S&P500 15mins:


Emini Nasdaq 100 15mins:


DAX Futures 15mins:


So where does this leave us? I wrote yesterday on the blog:
"Tuesdays are often my trend reversal days. Its possible that we may see a move back up to retest the 1333 S&P500 cash highs on Monday/early Tuesday, and this would provide a great low risk short entry. I personally will scale in at 1320 and then more up at the previous highs."I think last nights strong bullish reversal is all part of this move to "retest" that 1333 high (cash). I will be getting out of my longs into 1310-1315 and looking for shorts in 1320s. Use your fib retracements, res levels, candle reversals- whatever it is you use.

Is it now possible that we are looking at the right shoulder of a Head and Shoulders pattern playing out? A lot of bears will be cleaned out and discouraged given yesterday, which makes it an ideal backdrop.

Emini S&P500 60mins:


In Australia, despite the overnight volatile range, we are indicated at 4238 which puts us right back into yesterdays range. Sometimes it is best to keep things simple and the cash chart below shows our market coming back into decent supports in the 4250-4260 zone (cash). Thus, I will be looking for buy setups today as a short term trade for a potential retest of Fridays highs in coming days.

XJO 15mins:

My SPI range today: 4222 to 4260. Outlier levels 4285 and 4210.

My SPI plan today: I will look to  buy yesterdays low at 4230/4231 with tight stops and also look at the low 20s for another long entry. We may be under a bit of pressure early due to this (thanks Hipchat community): http://www.heraldsun.com.au/business/big-banks-on-notice-over-downgrade/story-fn7j19iv-1226257735392. The short term trend is still down so these long entries should be tight until we see more confirmation. I will look to cover any longs up at 4260 and will scalp short up there should I see price action tiring.

Monday, 30 January 2012

Monday Plan

Morning All,

I poured through the Daily charts over the weekend and put up a number of interesting setups on this post: http://swingtradersedge.blogspot.com/2012/01/weekend-homework.html. Please read this work as it provides the key backdrop for my current trading thoughts and plan.

On Friday in the S&P500 Eminis I wrote on this blog:
" I will be looking to short pullbacks vs last nights high on the S&P500 Eminis......I will look to get flat and/or buy at 1305 to 1310"

This worked well on Friday night with the Emins topping out at 1319 (the 50% retrace level off the 1330 high) and making a low at 1307. Price is now trading at the low end of the recent range. My strategy remains very much the same- looking to short at 1318/1322 and an aggressive short entry at 1328/1331. Use the appropriate stops based on your own timeframes and risk reward.

S&P500 Eminis 15mins:
The res zone labelled in red worked a treat on Friday night


Tuesdays are often my trend reversal days. Its possible that we may see a move back up to retest the 1333 S&P500 cash highs on Monday/early Tuesday, and this would provide a great low risk short entry. I personally will scale in at 1320 and then more up at the previous highs.

To Australia today. There was an interesting reversal on Friday right off the 200day moving average: http://swingtradersedge.blogspot.com/2012/01/weekend-homework.html. CBA put in a very bearish reversal candle, RIO reversed out of $70 and BHP out of $38 (see charts below). These are all warning signs but obviously need more confirmation before we can call a meaningful high. I believe we would need a "re-test" of Fridays highs and failure to confirm a more meanigful top.

My SPI range today: 4240 to 4270. Outlier levels 4230 and 4285.

My SPI Day trading plan: AUD has opened slightly weaker vs Fridays close and doesn't give any major clues early. The SPI sycomm closed at 4255 on Friday night. I would love a retest of 4280 to get short aggressively but we may not get that. There is also minor res at 4270 and this will be by intial fade spot. On the downside I will look to buy 4240/4245 with tight stops. I don't think that we see a breakdown today and am anticipating potential early weakness that holds and price grinds higher into cited res levels.

Good Luck
Austin

CBA Daily:
Bearish reversal candle. Is this a "fake" breakout in the making. The rally off the November lows looks like a clear "3" to me and not a new impulse.


BHP Daily:
Reversal out of resistance

RIO Daily:

Saturday, 28 January 2012

Weekend Homework

Just some weekend work. These are all the Daily setups on my radar currently. The market feels tired and I have stressed this enough of late. We have hit/are testing so many important resistance levels globally. We have begun to see some reversal candles in some markets. Next week will be an interesting one indeed.

S&P500 Daily:
A pop above the pitchfork midline and above the H+S neckline. A Daily close back below this would be a classic pop and drop or climatic spillover as some like to call it. When you combine this setup with all the other markets, it looks ominous to me. 666.5 X 2=1333.

DOW INDU Daily:
Rally right into overhead resistance and setting up a classic Double Top trade. Price showed a interesting reversal candle on Thursday. The wedge like nature adds to the climatic appeal. Have an entry signal ready to get short.

NASDAQ 100 Daily:
Island reversal pattern right at the top end of the range. This is bearish. Note that this is playing out whilst Apple released blow out numbers. This is exactly the sentiment conditions and socioeconomic backdrop for a meaningful top. I stressed that just because price closed above the previous high, this does not make it a decent  "breakout" trade. I feel the lack of base pattern and the very overextended nature sets this up for a classic bull trap. Look at the ascent of those trendlines- we are clearly in parabolic stage. Is there much more room left?


EUROPE

DAX Daily:
Rally right into the 61.8 Fib retracement level and overhead resistance with price leaving a Doji star on Friday. These Fib levels are my favourite for a turn. I successfully identified the DAX low back in September and October and this served me very well with a bottom shortly following across the board. Please see these posts: http://swingtradersedge.blogspot.com/2011_09_07_archive.html AND http://swingtradersedge.blogspot.com/2011_09_13_archive.html
I feel that a very similar scenario could play out here to the DOWNSIDE with a top forming.

ASIA

ASX200 Daily:
We saw a reversal candle on Friday right out of the top end of the range. Look in the past at what has happened in this zone after a bearish reversal candle. I looked for a top last week and originally nailed the A=C high, but after much back and forth trading price finally broke out to the upside. However, I do still think this is all part of a bigger picture Wave 4/consolidation pattern, with a resumption of the downtrend to come.

ASX200 Daily ii:
Very interesting that Fridays reversal was right on the 200day moving average. This line acts as a magnet and look at the past examples labelled here. It has dawned on me that the market needed to get to this line much like the DAX, S&P500 etc. I was bearish early as this was the target for the XJO. Now we are here

HANG SENG Daily:
Rally right into overhead resistance. To me this really does look all part of a bigger 3 wave move. A reversal candle would confirm a meaningful top.

KOSPI Daily:
Rally right into overhead resistance and the top end of the range. We are seeing some reversal candles begin to form.

In sum, I have no desire to chase the market up here for a bigger picture swing. Keeping it tight and nimble in either direction until we see more confirmation is the play. I think we will see a decent pullback at a minimum in coming days if not a genuine high. We cross that bridge when we come to it.

Austin

Friday, 27 January 2012

666.5 X 2= 1333

Morning All

Hope everyone down under had a nice Australia Day. Coming back to work after a boozy Thursday is pretty tough, and lets see if there is any volume today.

So last night the S&P500 made a high of 1333 and then sold off all day long. You know that I have been looking for a top since the S&P500 hit 1300 and you know that I have been early. I do find it interesting that the S&P500 low back in March 2009 was 666.5 and if you multiply this by 2, we get last nights high at 1333. Looking at all the major US cash charts, we now have a Daily reversal candle out of clear resistance zones. I have shown these resistance zones on multiple occasions in the Nasdaq, DOW Indutrials and S&P500 so I will not do it again here but pls see my last post: http://swingtradersedge.blogspot.com/2012/01/you-cant-fight-fed.html.

Is the top in? I don't know but here and now is as good a place as any. The market tried to push on post the FEDs announcement but got slapped back down. The Nasdaq Futures tried to breakout but failed. That is all interesting information. A 20pt move from high to low was one of the biggest pullbacks we have had in a while. Thus very simply, I will be looking to short pullbacks vs last nights high on the S&P500 Eminis with stops above 1335. I will look to get flat and/or buy at 1305 to 1310.

S&P500 Eminis 60mins i
Hits top end of channel and reverses

S&P500 Eminis 60mins ii
Sharp red reversal candle and one of the biggest reversals we have seen thus far. Support still remains 1300/1305. Only a move below there would confirm a bigger picture top.


Nasdaq 100 Futures 15mins:


I also think it is interesting that so many markets in Asia are also hitting key resistance areas. Some such as the Kospi show clear reversal candles.

Hang Seng Daily:


Shanghai A Shares Daily:
Breakdown and retest


Kospi Daily: 


To Australia today. We are indicated at 4250 with Sycomm highs at 4280. I don't have a clear setup today but on Wednesday certainly there was a shift in the character of the market from bearish to bullish. Was this a one hit wonder and bull trap? I am not sure and we can only deem this a failed breakout if price closes back below 4220 Cash. All the banks showed very strong breakout candles last trading session and we should use these as a clear marker i.e. if price breaks through Wednesdays low, that is bearish.

My SPI range today: 4220 to 4255. Outlier levels 4200 and 4280.

My SPI day trading plan today: I am looking to short the 50s if I see a bearish reversal candle for a quick fade. 4220 was solid support last trading session and I will look for longs there and at 4200. The short term trend is up so I will focus on this unless we crack through Wednesdays low.

Thursday, 26 January 2012

You Can't Fight the FED

Happy Australia Day All,

This will be just a quick post today. Australia Day is always one of my favourite days of the year and a great time to celebrate with mates and forget about the markets. Trading on Friday should be an interesting one ha!

So last night overseas markets looked very weak initially and pulled back right into support AGAIN. Then Mr Ben waved his wand. Then we went up...a lot. I am not a bitter man and I have always loathed those traders who cry conspiracy or rigged markets. It is what it is and we choose to play this game. Central banks are doing everything to keep this market awash with liquidity. Extending 0 rates until 2014 will certainly help.

Fortunately I covered my short position prior to the announcement but certainly I made a mistake in not pulling the trigger for the long trade out of support. Quite clearly, my bias played a factor in that. I wasnt able to be flexible. The information was there with the S&P500 holding support and then a strong breakout candle, but I didn't process it.

S&P500 Eminis 60mins:


Where does this leave us? I have no idea to be honest as I don't have a setup. Its as simple as that. The market is still right up against res, the breadth is still diverging, momentum is still waning, sentiment is frothy, BUT price doesn't want to go down. The trend remains up. The best way to play this is to keep it real tight and look for small moves in either direction for now. I talked about the Eminis needed to break 1300 for confirmation to get short and they didn't. The Nasdaq futures came off sharply as excepted but equally rallied post the FED announcement.

DOW Industrial Daily:
Coming into the zone. Maybe a bit higher to go? Either way, setting up for a great double top trade and resistance trade. Still looks ominous to me.

NASDAQ 100 Weekly:
I thought this was interesting. This is the move of the 2003 low. A potential big picture A=C comes in at 2465 i.e. right on last nights high.


NASDAQ 100 Daily:
There has been no real consolidation at all and thus why I deem this "breakout" highly susceptible. Any move back below yesterdays low will trigger a short to me. If you want to join a parabolic/vertical move then all yours. I know how they end up.


NASDAQ 100 Futures:
The Apple euphoria quickly got slapped down as I expected. A range has now built.

I will expand on Asia tomorrow.

Have a good one
Austin

Wednesday, 25 January 2012

Markets Top on Euphoria Right?

Morning All

Well the S&P500 held in AGAIN last night with that 1300 zone proving formidable in the Eminis. APPLE have just realised some blowout earnings results and the stock is trading up some 10% in after market. The Nasdaq futures are surging and are now well above the previous 2435 Daily high back in July 2011. Its game on right?

If you ask me, these are the EXACT conditions needed to form a genuine top. Remember when the market peaked on the euphoria of Osama bin laden? That was the top. All I am reading is "breakout" this and "breakout" that. Great but I really don't see the base pattern or the volume or anything to suggest this is the case. Am I being stubborn? Maybe but just bear in mind that these are exactly the moments and feelings that one should have at a genuine turning point. All markets are right up against previous highs or resistance points. Note the Eminis have not even made a new high yet above 1318. Have a quick read of twitter, and get a feeling for which way the crowd is leaning right now. I am reading predictions of 1338, 1350 and 1450 all of a sudden. All yours if you wanna join.

This has been my central case: http://swingtradersedge.blogspot.com/2012/01/new-week-same-message.html. Sure we haven't seen the confirmation yet. However, if the Nasdaq futures get slapped back down (which i think it will), that will be a bearish engulfing pattern and seal the deal to me. The S&P500 Eminis put in a climatic reversal at 1318 on monday night, and price is now "testing" this previous high. Any move below 1300 would now seal that market to me. If you want confirmation, that should be it. Remeber that tops are a process that take time with much back and forth choppiness. This is exactly what we are seeing over the past few days and sessions.

S&P500 Eminis 60mins:


To Australia. For the last 4 trading days we have opened strongly/gapped up, and then got slapped down straight away giving up all gains. That really is a tired market and has offered great trading opportunities for the bears. Is today the day where finally it gets going and breaks out? I really don't know but I will continue to fade that morning open into resistance. That is the low risk/high reward. The minute that stops working, then we probably do have a genuine move higher.


XJO 15mins


My SPI range today: 4220 to 4180. Outlier levels 4150 and 4235.

My SPI day trading plan today: The SYCOMM session closed at 4202 but we will obviously open above this given the move in the S&P500 Eminis and Nasdaq futures. 4220 offered solid resistance yesterday and I will once again short that level with stops above 4225. Previous highs were also at 4230/4235 which offers another shorting opportunity. If price shows nothing but green candles straight out of the open and drives straight through this, I will look for pullbacks to join a new trend higher. Until then, this is still within a range. As per yesterday, scalping long levels remain 4200 and the 4180s.